Content supplied by PwC
Despite a projected slowdown in Chinese growth after around 2020, the global economic power shift away from the established advanced economies in North America, Western Europe and Japan, will continue over the next 35 years, according to the latest report from PwC economists, The World in 2050: Will the shift in global economic power continue?
PwC Economics Director Chris Money says, “New Zealand’s future truly lies with China and our forecasts reinforce the importance of New Zealand's focus on Pacific Rim trade deals, with China, Indonesia, Mexico and Russia, forecast to be amongst the fastest growing economies to 2050.
“Currently, China is equal with the US in purchasing power parity (US$17 billion each) but by 2050, China's GDP in purchasing power parity (PPP) terms will treble to US$60 billion, which is 25% higher than the US, and more than three times the combined GDP (in PPP terms) of the EU.
“Trade between the fastest growing countries presents real opportunities for New Zealand as a transit point for goods and services both by air and sea. Links between South America and the fast-growing block of China, Indonesia and India present significant opportunities for us as a trans-shipment destination,” says Mr Money.
India has the potential to sustain its higher growth rate for longer and become a US$10 trillion economy by around 2020 in purchasing power (PPP) terms, or around 2035 at market exchange rates. But this relies on India making sustained progress on infrastructure investment, institutional reforms and boosting education levels across the whole population.
“The importance of New Zealand's free trade discussions with India are underlined by this forecast as the fastest growing of our largest trading partners and set to become the second largest economy in the world by 2050,”concludes Mr Money.
The report presents long-term projections of potential GDP growth up to 2050 for 32 of the largest economies in the world, covering 84% of total global GDP and indicates that the world economy is projected to grow at an average of just over 3% per annum from 2014-50 – doubling in size by 2037 and nearly tripling by 2050.
But there’s likely to be a slowdown in global growth after 2020, as the rate of expansion in China and some other major emerging economies moderates to a more sustainable long-term rate, and as working age population growth slows in many large economies.
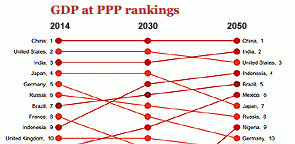
There are different ways of comparing the size of economies, but the report projects that China will be the largest economy by 2030 on any measure.
However, its growth rate is expected to slow markedly after around 2020 as its population ages, its high investment rate runs into diminishing marginal returns and it needs to rely more on innovation than copying to boost productivity.
Eventual reversion to the global average has been common for past high growth economies such as Japan and South Korea and we expect China to follow suit.
Table 1 below sets out how PwC projects global GDP rankings will evolve. The report also contains projections based on GDP at market exchange rates, without this relative price adjustment. On that basis, China is projected to overtake the US in around 2028, while India would clearly be the third largest economy in the world in 2050, but still some way behind the US.
Table 1: Projected global GDP rankings in PPP terms (at constant 2014 US dollars)
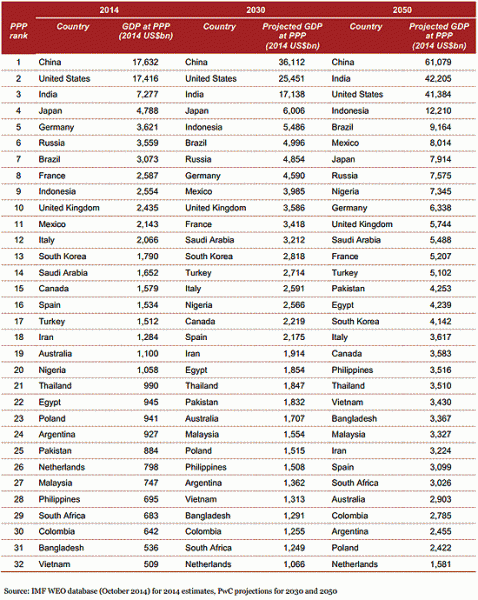
Source: IMF World Economic Outlook database (Oct 2014) for 2014 estimates, PwC projections for 2030 and 2050
Table 2 below sets out the average annual real GDP growth rates underlying these projected GDP rankings, splitting out the influence of population growth and average income growth per person:
Table 2: Projected average real GDP growth rates (% per annum, 2015-50)
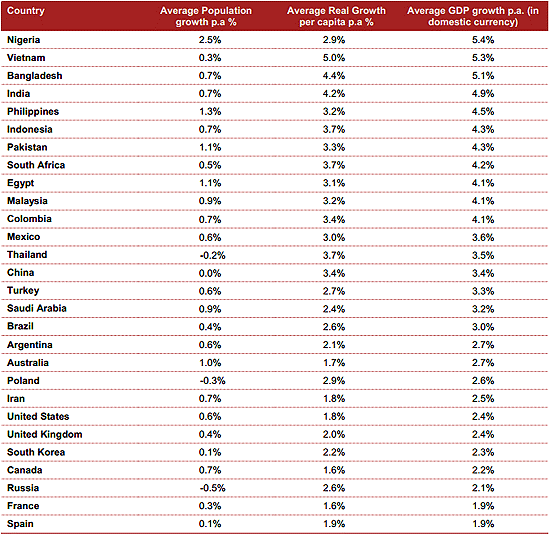
Source: PwC analysis based on UN population projections
Aside from China and India, other highlights from PwC’s projections in Tables 1 and 2 are:
• Emerging economies like Indonesia, Brazil and Mexico have the potential to be larger than the UK and France by 2030, with Indonesia possibly rising as high as 4th place in the world rankings by 2050 if it can sustain growth-friendly policies.
• Nigeria, Vietnam and the Philippines are notable risers in the global GDP rankings in the long term, reflecting relatively high projected average growth rates of around 4.5-5.5% per annum over the period to 2050.
• Malaysia is also projected to grow at around 4% per annum on average in the period to 2050, which is higher than China’s projected average growth rate of around 3.5% per annum over this period, and an impressive performance for what is already a middle income country.
• Colombia is also an economy that PwC projects to grow at a relatively healthy long term rate of around 4% per annum over the period to 2050, noticeably faster than its larger Southern American neighbours like Brazil and Argentina.
• Japanese growth is projected to be the slowest of all 32 countries covered in total terms, driven in part by a steadily declining population; as a result Japan is projected to fall from 4th to 7th place in the global GDP rankings over the period to 2050.
• European economies tend to slide down the rankings, with growth rates in the major Eurozone economies projected to average only around 1.5-2% per annum to 2050.
• Poland is projected to have the highest average growth rate of the large EU economies, and also to outperform Russia in terms of long-run growth.
PwC also estimates what its projections would mean for shares of global GDP at PPPs (assuming the smaller countries not covered in the model grow on average as a group at the same rate as the 32 large economies covered by the study) As Figure 1 below shows:
• China’s share of world GDP is projected to flatten off at around 20% from the mid-2020s onwards as its growth rate reverts to the global mean.
• The US’s share declines gradually from around 17% now to around 14% by 2050, while India’s potentially doubles from around 7% now to be more or less neck and neck with the US by the middle of the century in PPP terms.
• The EU’s overall share of world GDP is projected to decline from around 17.5% now to only around 12% by 2050, assuming that total EU GDP grows at the same rate as the aggregate for the largest seven EU economies covered by the study.
Figure 1: Shifting global economic power: projected shares of world GDP in PPP terms
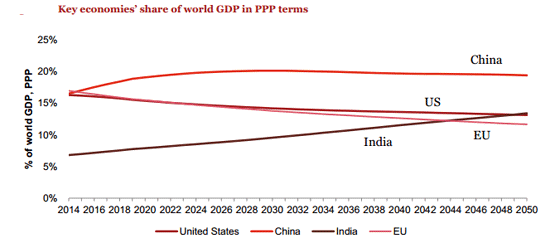
Source: PwC projections starting from IMF estimates for 2014
These projections assume, however, that emerging markets will follow broadly growth-friendly policies.
In practice, not all may do so and therefore not all of these economies will fulfil the potential indicated by the PwC growth projections, although some could also exceed the projections if they can accelerate their investment rates and institutional reforms.
PPPs vs MERs:
There is no single correct way to measure the relative size of economies at different stages of development. Depending on the purpose of the exercise, GDP at either market exchange rates (MERs) or purchasing power parity rates (PPPs) may be the most appropriate measure. In general, GDP at PPPs is a better indicator of average living standards or volumes of outputs or inputs because this correct for relative price differences, while GDP at MERs is a better measure of the relative total size of markets for businesses at a given point in time. However, historical evidence shows that MERs will generally, in the long run, tend to move up towards PPPs for emerging economies as their average income levels gradually narrow the gap with the current advanced economies. An econometric equation within the PwC long-term growth model that reflects this historical relationship forms the basis for the projections of GDP at MERs in the report. This also makes the common simplifying assumption that PPP exchange rates remain constant in real terms over time. Projections of MERs are subject to particularly high margins of uncertainty, however, which is why both the report and this media release focus primarily on projections of GDP at PPPs.
A copy of the full report The World in 2050 Will the shift in global economic power continue? is available at http://www.pwc.co.nz/publications/the-world-in-2050-will-the-shift-in-g…
2 Comments
Somehow I don't think the next 35 years are going to follow a similar tragectory to the last 35 years. It'd be nice if we lived on a flat earth, but unfortunatly we live on a spherical planet with finite resources. It's not just land that they aren't making more of, also on the list of stuff that you can't make more of, is oil, coal, gas, metals and minerals. I'm not sure how the economy can continue to grow forever when the resources that are used to make the Products in GDP are in most cases finite or renewable at a much slower rate then we are consuming them today. Maybe we will hit a few snags seeing as GDP has a CAGR of 3%, and debt has a CAGR of 10%, could be tricky getting much growth once your balance sheet gets to highly leveraged. Of course we are going to burn through as many fossil fuels as we can manage which isn't such a good idea considering the last time CO2 levels were this high the oceans were 20 meters higher then they are today. Creating more CO2 can only make things worse.
We are already very dependent on China both directly and indirectly through Australia. It is unwise to be too dependent on any one market or product. We need to also try very hard to diversify. Things could go pear shaped in China soon. 23% of apartments are unoccupied And the whole country has a grossly over build. (how many resources will Australia be selling them in the coming years?) If that isn't a bubble about to burst, I don't know what is. Total debt to GDP is growing at an alarming rate and is heading up to the levels of Greece and Ireland. A crash in China will affect us very badly.
We welcome your comments below. If you are not already registered, please register to comment
Remember we welcome robust, respectful and insightful debate. We don't welcome abusive or defamatory comments and will de-register those repeatedly making such comments. Our current comment policy is here.