
Since January 1979, the New York Times has been publishing temperature charts in its print editions, initially focused on its home city.
Since then it has expanded the record to other cities, and today it published them on-line and for 3,135 cities, 1,334 of them outside the US.
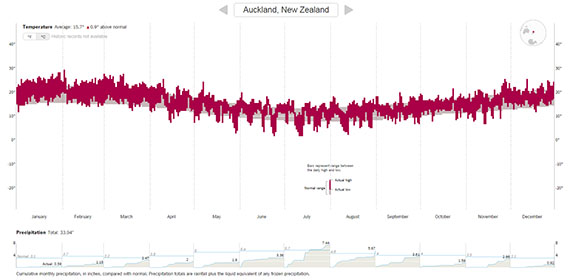
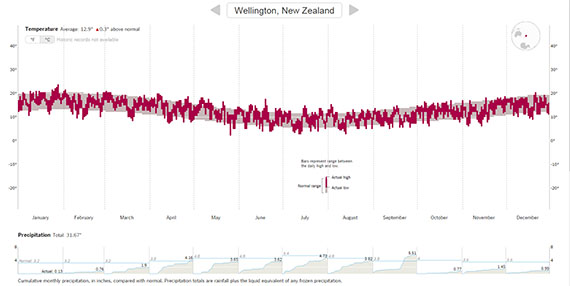
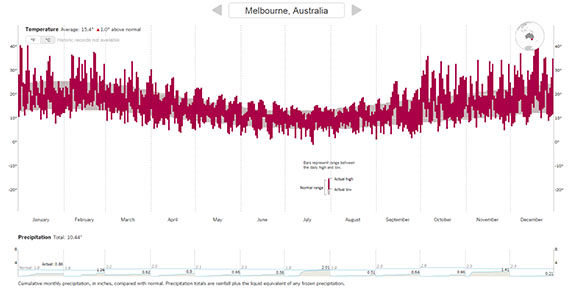
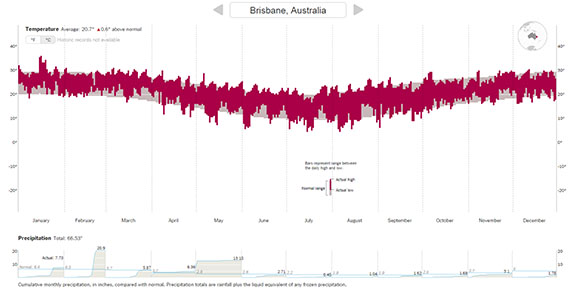
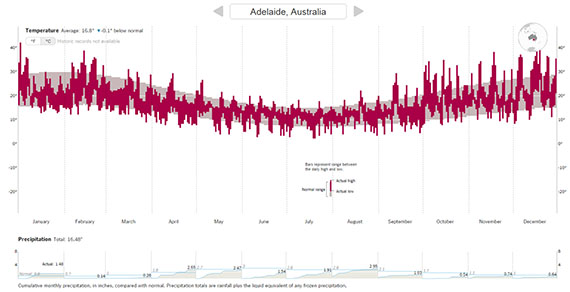
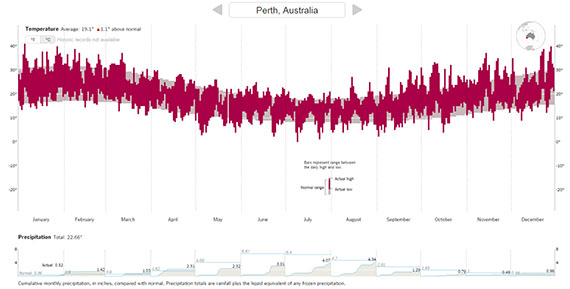
We thought it might be useful for New Zealand readers to get a look at a few cities that we are familiar with.
Unfortunately, their database only includes two New Zealand cities.
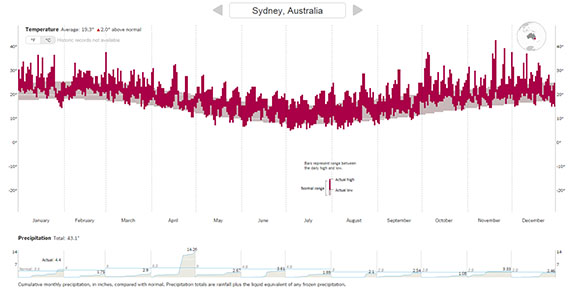
But it does include the main Australian cities.
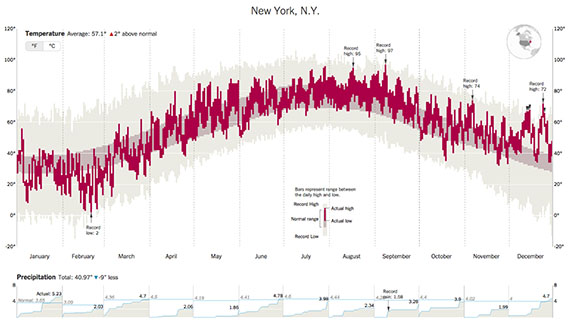
Here is the chart for New York:
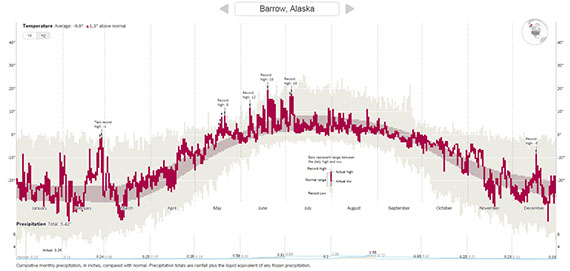
Barrow, Alaska is one of the world's most northern cities:
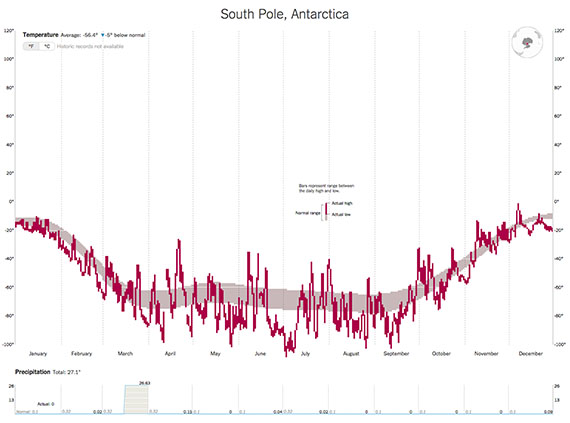
And here it is for Antarctica:
You can find their tool here and make your own selections.
The grey range in each chart is the 30 year average through to 2010. The red data is the 2015 daily readings.
4 Comments
People are always interested in themselves and where they live, but temperatures in cities are a very poor indicator of the big picture.
What really matters is the temperature of the oceans because that is what ultimately determines the temperature in most cities.
https://en.wikipedia.org/wiki/Global_warming#/media/File:Energy_change_…
The temperature of the oceans has been rising
https://scripps.ucsd.edu/news/1858
And the rate of increase has now reached a critical point, especially in the Arctic, where ice is melting at an unprecedented rate when it would normally be freezing, as a consequence of very elevated temperatures.
http://data.giss.nasa.gov/gistemp/maps/
The disruption of the jet streams that has occurred as a consequence of Artic overheating leads to wild swings in temperatures (so-called Arctic Vortex), as explained by Dr Jennifer Francis.
https://www.youtube.com/watch?v=gAiA-_iQjdU
New Zealand, being surrounded by deep, cool water, does not experience the extremes witnessed elsewhere, but is nevertheless going to suffer very badly as a consequence of the ever-increasing atmospheric loading of CO2, now at a record high (404ppm) and rising at an unprecedented rate.
https://scripps.ucsd.edu/programs/keelingcurve/wp-content/plugins/sio-b…
Whether we will witness an ice-free Arctic this year is still debatable but all the preconditions necessary for that currently prevail, with a further loss of 17,000km2 of ice in the latest update.
http://nsidc.org/arcticseaicenews/charctic-interactive-sea-ice-graph/
Sadly, most people in NZ don't even know any of this is happening, or think it will not affect them and their children, and everything the government does makes the predicament worse.
Oh come on DC....really?
Warmth in and by itself well only kills a few thousands directly in heat waves, its what it does to crops that is the major concern, thats slower of course, or ppl migrate and maybe drown trying to get to Europe.
Another day of ice in the Arctic melting (7,000 km2 gone in the latest update) when it should be freezing, and the ice maximum for 2016 may have been reached a month earlier than normal:
http://nsidc.org/arcticseaicenews/charctic-interactive-sea-ice-graph/
Also, atmospheric carbon dioxide is at an all-time [in the history of the human species] high of 404ppm, and is on track for over 406ppm in a few months:
https://scripps.ucsd.edu/programs/keelingcurve/wp-content/plugins/sio-b…
I wonder at what point denial will morph into panic.
Yet another day of Arctic meltdown. Another 14,000km2 of ice lost in what is normally the refreeze season..
'Since January 1979, the New York Times has been publishing temperature charts in its print editions, initially focused on its home city'
Not only will New York be getting very different weather from the historic norm, but it will also be completely inundated by sea level rise earlier than previously thought.
And what happens in the Arctic doesn't stay in the Arctic.
We welcome your comments below. If you are not already registered, please register to comment
Remember we welcome robust, respectful and insightful debate. We don't welcome abusive or defamatory comments and will de-register those repeatedly making such comments. Our current comment policy is here.