Analysis by the World Gold Council.
On hitting its 50th all-time high of US$4,294 on 20 October, gold gave back most of its intra-month gains to finish the month up 5% at US$4,012/oz. Despite the pull-back, gold gained ground in all major currencies on a slightly stronger US dollar (Table 1).
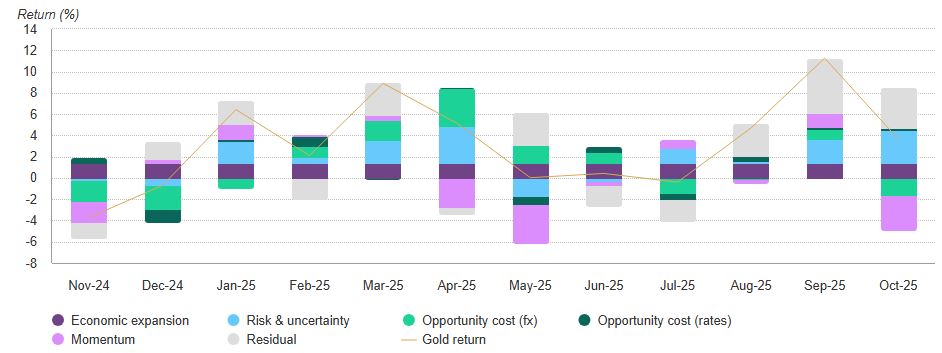
Our Gold Return Attribution Model (GRAM) suggests the monthly gain was helped by a pick-up in implied volatility and geopolitical risk. A momentum reversal with likely profit taking and a stronger US dollar held back further gains.
In the absence of COMEX futures positioning due to the US government shutdown, a drop in aggregate open interest for COMEX gold futures suggests longs were liquidated during October. This means the residual is likely smaller than it would be without that data.
Chart 1: A momentum reversal and dollar strength weighed on returns while geopolitical risk and volatility boosted gold
Sources: Bloomberg, World Gold Council; Disclaimer
*Data to 31 October 2025. Our Gold Return Attribution Model (GRAM) is a multiple regression model of monthly gold price returns, which we group into four key thematic driver categories of gold’s performance: economic expansion, risk & uncertainty, opportunity cost, and momentum. These themes capture motives behind gold demand; most importantly, investment demand, which is considered the marginal driver of gold price returns in the short run. The ‘residual’ represents the percentage change in the gold price that is not explained by factors already included. Results shown here are based on analysis covering a five-year estimation period using monthly data. Alternative estimation periods and data frequencies are available on Goldhub.com.
Table 1: Gold gained in all currencies as the broad dollar index picked up
Gold price and performance in key currencies*
| |
USD
(oz) |
EUR
(oz) |
JPY
(g) |
CAD
(oz) |
INR
(10g) |
RMB
(g) |
AUD
(oz) |
| October price* |
4,012 |
3,477 |
19,860 |
5,620 |
120,450 |
920 |
6,129 |
| October return* |
4.9% |
6.9% |
9.3% |
5.5% |
5.0% |
5.5% |
6.1% |
| Y-t-d return* |
53.8% |
37.9% |
50.4% |
49.7% |
58.7% |
49.4% |
45.3% |
| Record high price* |
4,294 |
3,686 |
20,804 |
6,025 |
129,828 |
999 |
6,592 |
| Record high date* |
20 Oct 2025 |
20 Oct 2025 |
20 Oct 2025 |
20 Oct 2025 |
17 Oct 2025 |
17 Oct 2025 |
20 Oct 2025 |
*As of 31 October 2025. Based on the LBMA Gold Price PM in USD, expressed in local currencies, except for India and China where the MCX Gold Price PM and Shanghai Gold Benchmark PM are used, respectively.
Source: Bloomberg, World Gold Council
Reset or rout?
Our forward-looking focus this month is purely on price action, given that this report comes hot on the heels of our fundamentals-focused Q3 Gold Demand Trends report and ahead of our longer-term 2026 Outlook. Our key technical takeaways:
- An uptrend that had run too far too fast with overbought momentum levels
- Volatility spikes similar to previous major peaks
- Suggestions of a pause/correction in the long-term trend to unwind overextension
- But, no long-term momentum “sell” signal in place, and analogs provide no signal of a larger decline
- Fundamentals remain solid.
Technicals dissected
Gold’s October peak marked a 66% gain for the year. The pace of the move from mid-August resulted in historically overbought technical momentum levels, with the market also more than 25% above its long-term 200-day average. This has historically signalled a “typical” overstretched extreme (Figure 1).
The sharp rise in volatility when the price peaked in the third week of October was similar to levels seen at the 2020, 2022 and April 2025 peaks. Combined with a weekly Relative Strength Index (RSI) momentum “sell” signal, this suggests we have seen an uptrend that has run too far too fast and a pause/correction to unwind this extreme overbought condition, is likely necessary (Figure 2).
With no long-term momentum “sell” signals seen thus far, our view is that an October decline will likely provide a healthy and much needed breather in the core long-term uptrend.
Figure 1: Gold at strong deviation from moving average
Gold spot (XAU) and 20% above the 200-day moving average*
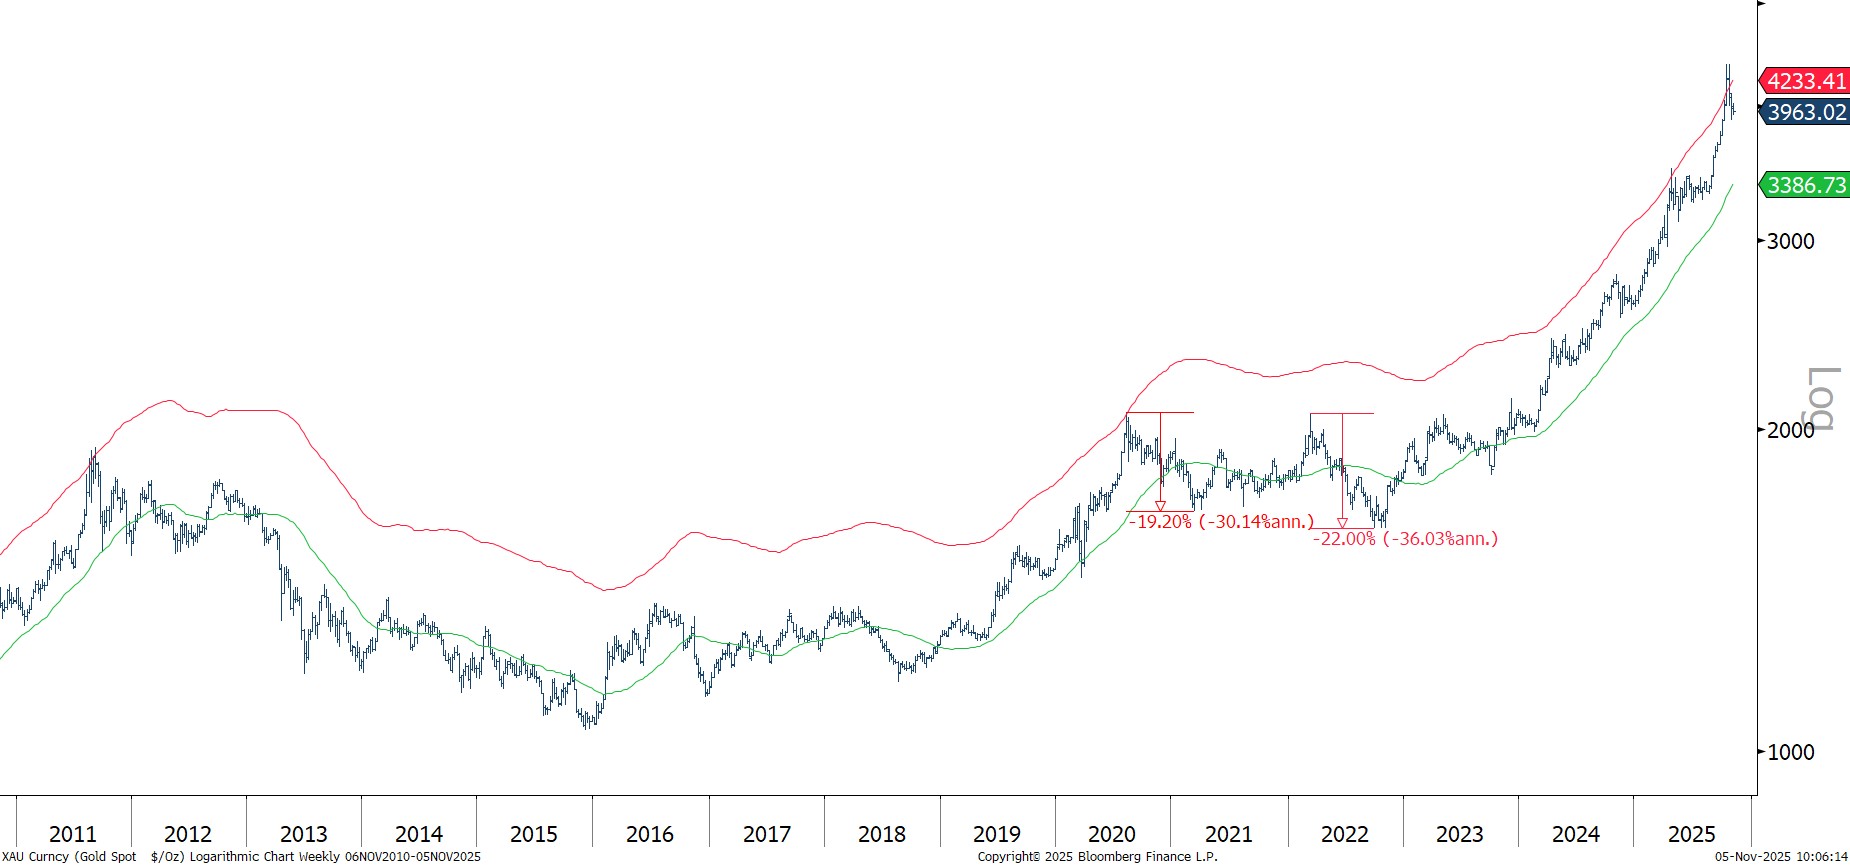
*Daily data to 5 November 2025
Source: Bloomberg, World Gold Council
Figure 2: Gold’s RSI at stretched levels
Gold spot price (XAU) and RSI*
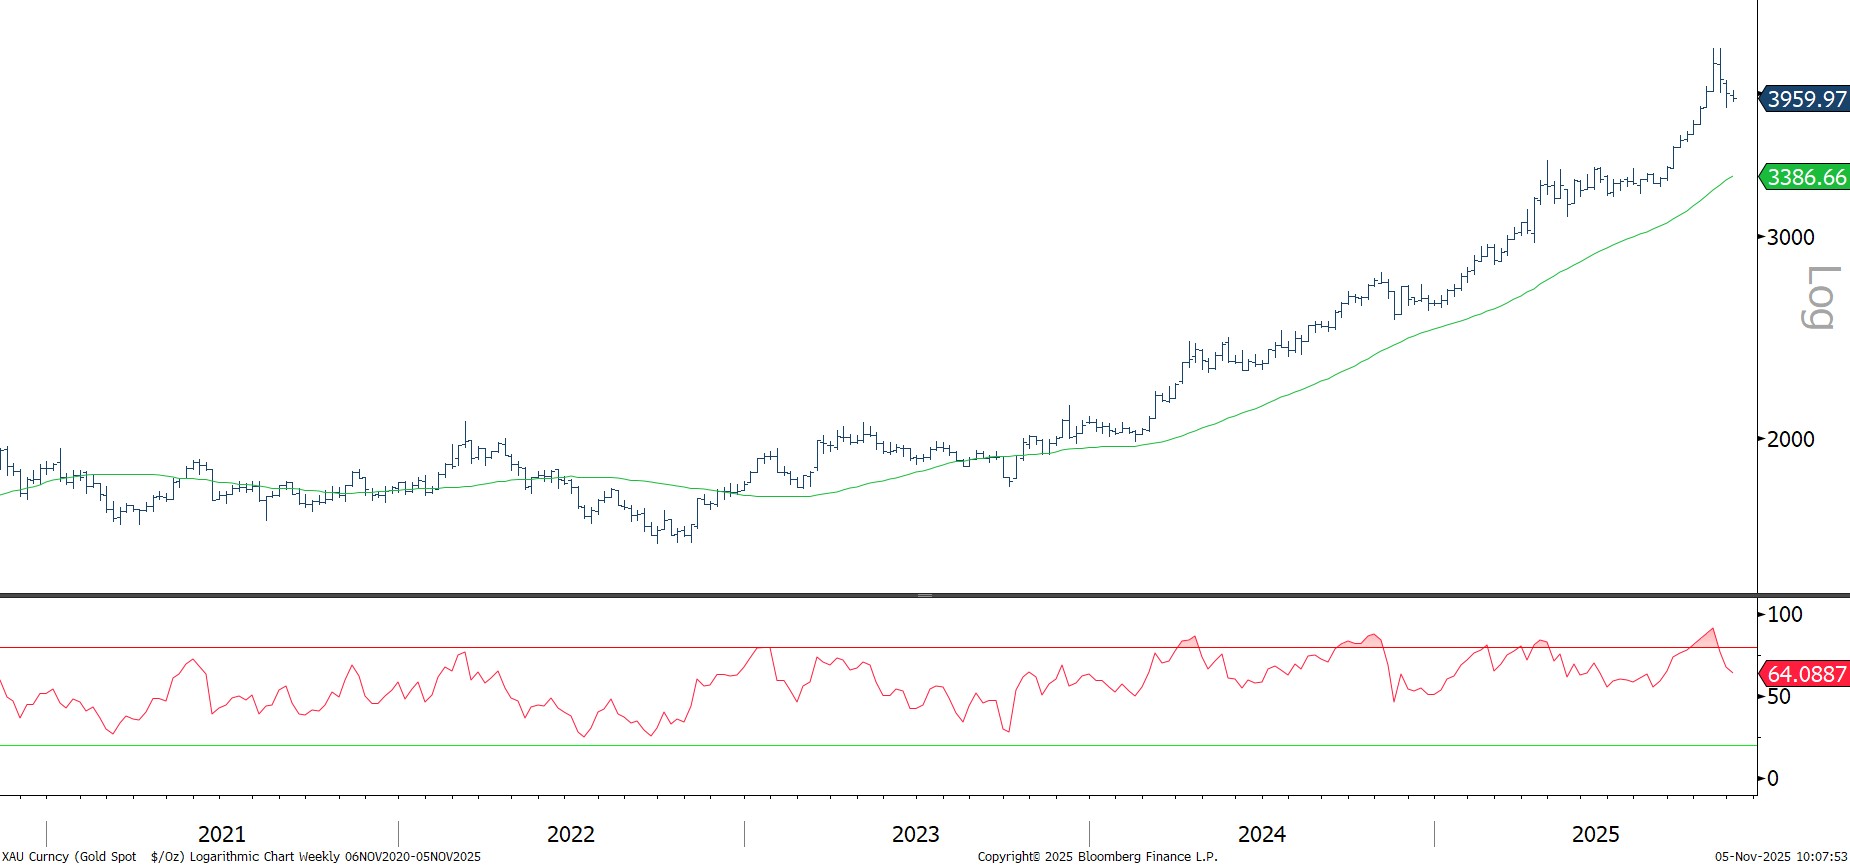
*Weekly data to 5 November 2025
Source: Bloomberg, World Gold Council
Figure 3: Fibonacci retracement sets possible floors
Gold spot price (XAU) and Fibonacci retracement*
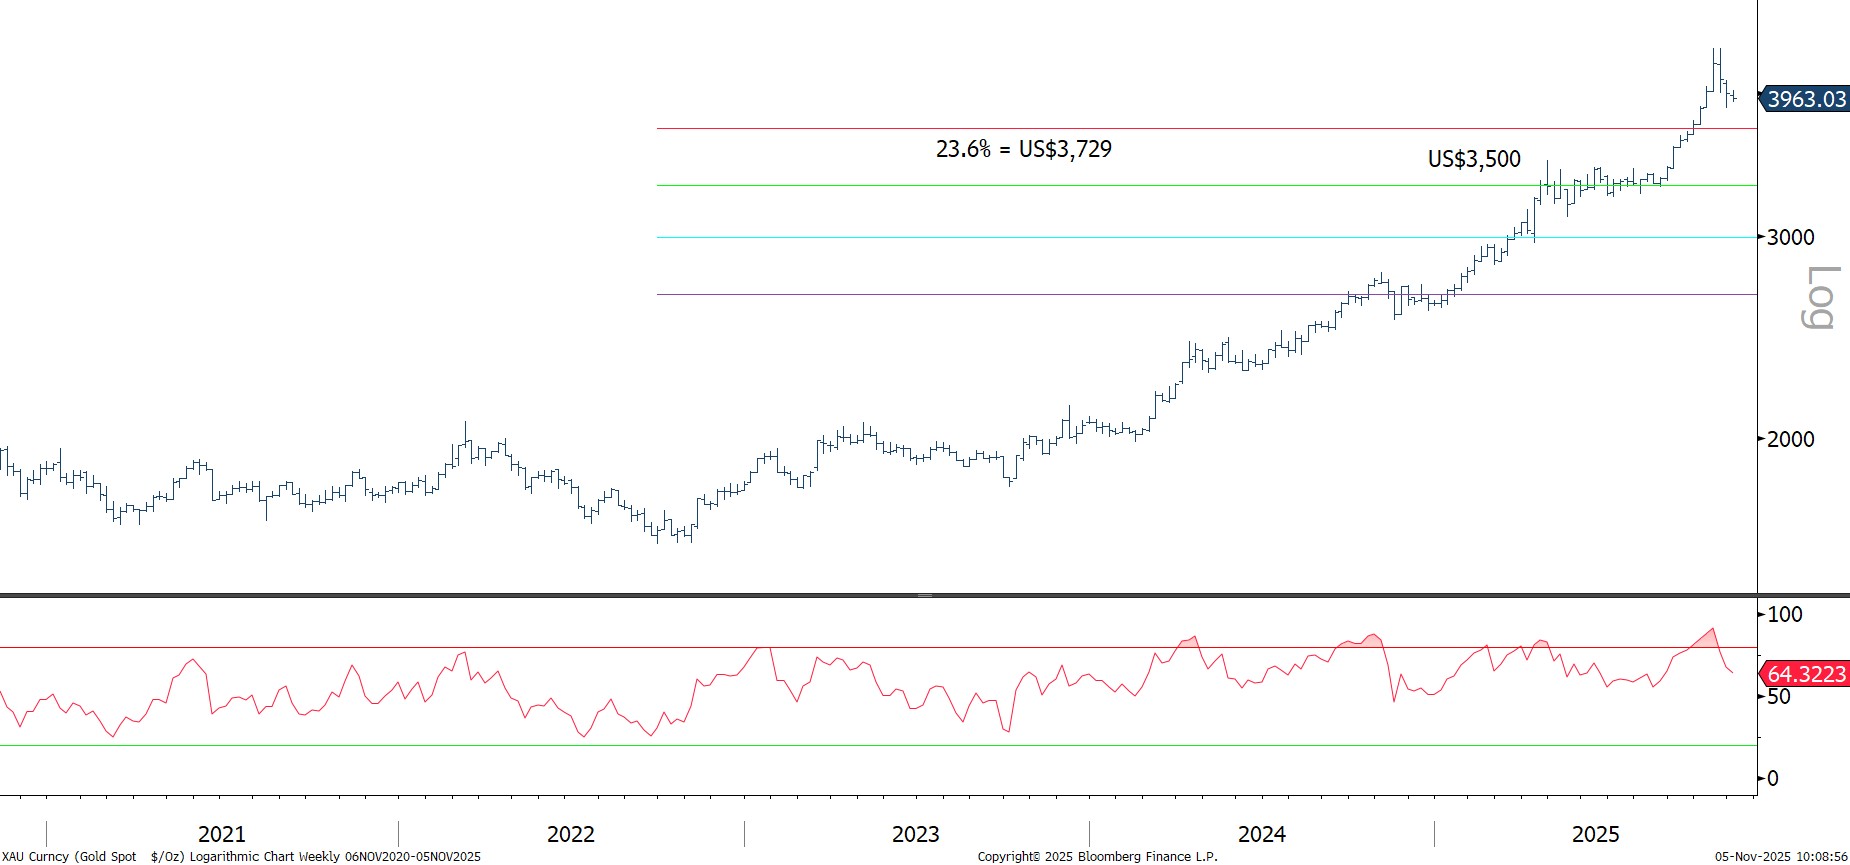
*Weekly data to 5 November 2025
Source: Bloomberg, World Gold Council
What’s next
The key questions are more likely to be how long can such a phase last and what is the potential magnitude of a setback?
We note that first key technical support is seen around its medium-term 55-day average and initial Fibonacci retracement of the rise from the 2022 low, both of which are near US$3,800/oz; at this point we would expect to see classic “dip buyers” step back in (Figure 3). Longer-term and more important support is seen at the US$3,500/oz April peak, which, if seen, would represent a fall similar to those that occurred in 2020 and 2022.
Should gold march higher, technical resistance levels above the US$4,382/oz current peak are seen next at US$4,420/oz, then US$4,500/oz-US$4,520/oz, ahead of US$4,675/oz.
Analog signal
In addition to the more traditional technicals, we examined historical price analogs - moments in the past that “look similar to now” – which some traders/commentators use intuitively to gauge what could happen next.
They’re visually compelling but likely spurious, relying on too- simple a premise, so we tested whether such parallels have historically held any predictive value.1
We limited the number of analogs to the top four most correlated, in order to reduce computation time. Currently, three of these four point to lower prices ahead (Figure 4).2 How reliable has this signal been in the past? Little better than a coin toss, according to our results, which is probably not a surprise (Table 2).
When all analogs point in the same direction, the historical hit rate improves. But those occurrences are too rare to make them statistically convincing.
So a damp squib…but also somewhat reassuring, except for those that rely on such indicators. In our view, there is no clear and reliable signal of an impending price rout.
Figure 4: Three of four analogs point to lower prices over the next month…but is this a reliable signal?
Gold spot price (XAU) currently and during the most correlated historical ‘analogs’*
*Data is daily from 31 December 1971 to 24 October 2025. The date above the chart corresponds to T=0 in the x-axis. Corr responds to the correlation score that selected the analog. The past analog raw prices are on the left y-axes, while the current price move is on the right in each chart.
Source: Bloomberg, World Gold Council
Table 2: Our analysis suggest that past analogs provide little value as a forecasting tool
Backtesting of forecast quality of analog gold price moves*
| Training |
Short |
Medium |
Long |
| Training window (days) |
66 |
66 |
200 |
200 |
777 |
777 |
| Forecast window (days) |
22 |
22 |
40 |
40 |
252 |
252 |
| Number of analogs tested |
4 |
4 |
4 |
4 |
4 |
4 |
| Testing |
Short |
Medium |
Long |
| 3/4 analogs up |
47 |
|
16 |
|
3 |
|
| 3/4 analogs down |
30 |
|
17 |
|
1 |
|
| 4/4 analogs up |
|
9 |
|
6 |
|
1 |
| 4/4 analogs down |
|
3 |
|
10 |
|
0 |
| Accuracy when 3/4 are up |
60% |
|
63% |
|
67% |
|
| Accuracy when 3/4 are down |
47% |
|
53% |
|
0% |
|
| Accuracy when all 4 are up |
|
67% |
|
83% |
|
0% |
| Accuracy when all 4 are down |
|
67% |
|
50% |
|
- |
*Data is daily from 31 December 1971 to 24 October 2025. The training window is the current rally compared to ‘similar’ analog price moves in the past, based on z-score correlation. The Forecast window is what happened subsequent to those past analogs. We tested how well the signal forecast subsequent price direction, up or down. First we looked at the accuracy in predicting direction when three out of four analogs were pointing in the same direction, as we have today. Then we looked at how useful four analogs pointing in one direction were. Accuracy measures the proportion of subsequent moves predicted in the same direction by the analogs.
Source: Bloomberg, World Gold Council
In summary
Our recently published Q3 Gold Demand Trends gives investors the low-down on demand and supply fundamentals, so we opted to focus purely on price dynamics in this month’s GMC. This is of particular interest given murmurs of pure speculative / momentum driven price action. Our analysis suggests that we were overdue a pause/correction, but the longer-term technical signals have not strayed into sell territory.
And this chimes with the fundamental story emanating from the global gold ETF, bar and coin and central bank space. The drivers of these remain positively charged:
- Global gold ETFs are supported by a strategic supplanting of bonds as an equity-hedge at the margin, given the higher-than-normal stock-bond correlation
- Hedging of US assets, promoting marginal diversification into less crowded assets. US dollar hedging makes US assets work harder for foreign investors
- Fundamental drivers at ‘gold-friendly’ levels: real rates are high, the US dollar remains expensive on an REER basis, Credit spreads remain at record lows and equities highly concentrated and expensive
- Geopolitical tensions, the prospect of higher prices and a lack of alternatives continue to support bar and coin demand
- Central bank accumulation broadening with lower price sensitivity, similar to what we have seen in bar and coin demand
Footnotes
To measure similarity, we tried two approaches: simple Pearson correlation and a z-score-based cross-correlation. The z-score method proved most effective. Unlike Pearson, which is sensitive to level differences, the z-score approach standardises each window and focuses on pattern similarity rather than absolute price levels. It helps downplay spurious correlations that can arise purely from shared long-term trends. We chose to work with prices rather than returns because visual pattern recognition - the essence of technical analogs - relies on shapes and turning points, not on the noise of day-to-day changes. That does increase the risk of spurious correlation, but this exercise is more about technical context than strict statistical inference. To further reduce bias, we excluded overlapping historical windows, ensuring each analog was genuinely distinct rather than a near-duplicate of a neighbouring period.
We built a simple framework to test whether price analogs have predictive power. For each date in history the model looked back over a fixed window (e.g., 66 trading days, about three months) and found the most similar past price patterns. It then measured how prices moved in the following period (e.g., 22 days, roughly one a month) after those analogs. By repeating this across time, avoiding overlapping windows, and comparing predicted vs. actual outcomes, we estimated how often the analogs correctly anticipated direction. We also tested different window lengths and thresholds for agreement among analogs (for instance, requiring all or most to point in the same direction). This allowed us to quantify how often such visual patterns translated into reliable forecasting value.
This article is a re-post from here.
 Our free weekly precious metals email brings you weekly news of interest to precious metals investors, plus a comprehensive list of gold and silver buy and sell prices.
To subscribe to our weekly precious metals email, enter your email address here.
Comparative pricing
You can find our independent comparative pricing for bullion and coins in both US dollars and New Zealand dollars which are updated on a daily basis here »


We welcome your comments below. If you are not already registered, please register to comment
Remember we welcome robust, respectful and insightful debate. We don't welcome abusive or defamatory comments and will de-register those repeatedly making such comments. Our current comment policy is here.