Gold’s impressive surge
Investing
/ opinion
Gold’s outlook for 2026 is being defined by the uncertain economic environment that investors currently face. And, just like 2025, the upcoming year may bring significant volatility across financial markets
6th Dec 25, 10:21am
by
Analysis by the World Gold Council.
Gold has experienced a remarkable 2025, achieving over 50 all-time highs and returning over 60%.1 This performance has been supported by a combination of heightened geopolitical and economic uncertainty, a weaker US dollar, and positive price momentum. Both investors and central banks have increased their allocations to gold, seeking diversification and stability.
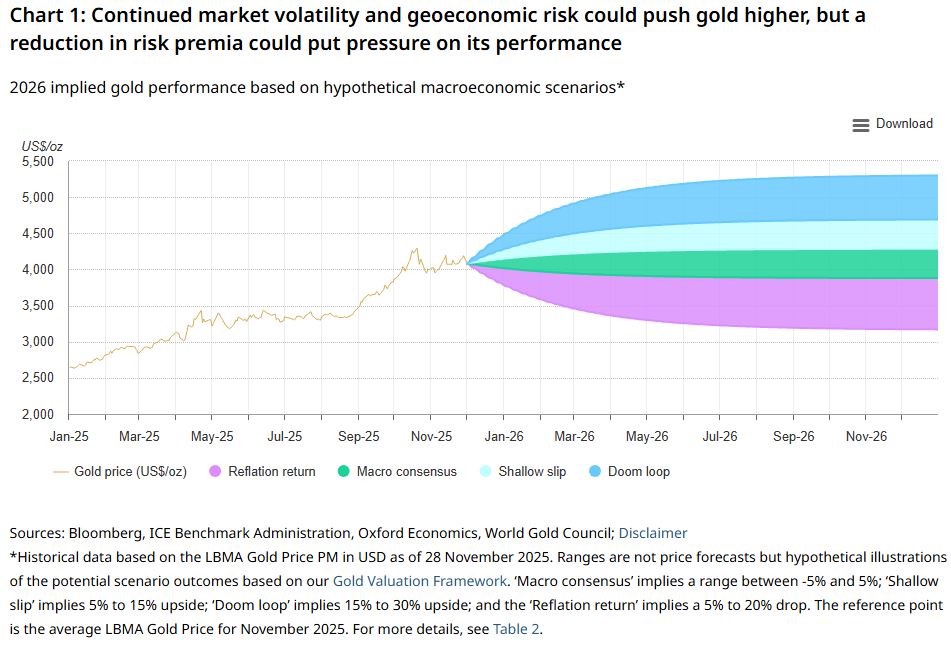
Looking to 2026, the outlook is shaped by ongoing geoeconomic uncertainty. The gold price broadly reflects macroeconomic consensus expectations and may remain rangebound if current conditions persist. However, taking cues from this year, 2026 will likely continue to surprise. If economic growth slows and interest rates fall further, gold could see moderate gains. In a more severe downturn marked by rising global risks, gold could perform strongly. Conversely, a successful outcome from policies set by the Trump administration would accelerate economic growth and reduce geopolitical risk, leading to higher rates and a stronger US dollar, pushing gold lower.
Additional factors, such as central bank demand and gold recycling trends, could also influence the market. Most importantly, gold’s role as a portfolio diversifier and source of stability remains key amid continued market volatility.
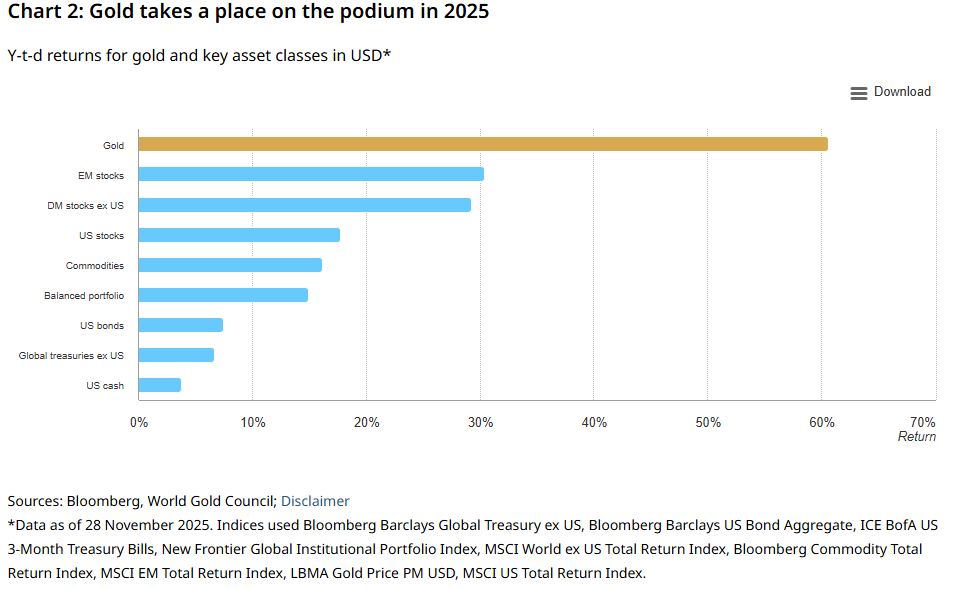
After setting more than 50 all-time highs and edging over 60% by the end of November, gold has emerged as one of the strongest performing assets in 2025 (Chart 2).
This historic rally, gearing up to be gold’s fourth strongest annual return since 1971,2 has been driven by a combination of factors.
At a macro level, two stand out:
- A supercharged geopolitical and geoeconomic environment
- Generalised US dollar weakness and marginally lower rates.
This environment has resulted in a broader push for portfolio diversification amid lacklustre bond returns and concerns of frothiness in equity markets.
Against this backdrop and further supported by gold’s positive momentum, investment demand has surged across all regions from West to East.
At the same time, central banks continued their buying spree – with demand well above average, even if below the records seen in the previous three years.
Our Gold Return Attribution Model (GRAM) – summarised in Chart 3 and Table 1 – indicates that the high-risk environment explains roughly 12 percentage points of gold’s y-t-d return, primarily driven by geopolitical risk. Reduced opportunity cost – through a weaker US dollar and marginally lower rates – contributed another 10 percentage points.
Within the two factors above, the combined effect of heightened geopolitical risk and US dollar weakness accounted for roughly 16 percentage points. This underscores the outsized influence of politics and macro uncertainty on gold’s performance so far during Trump’s second term.
Further, price momentum and investor positioning contributed nine percentage points, while economic growth added 10 points.
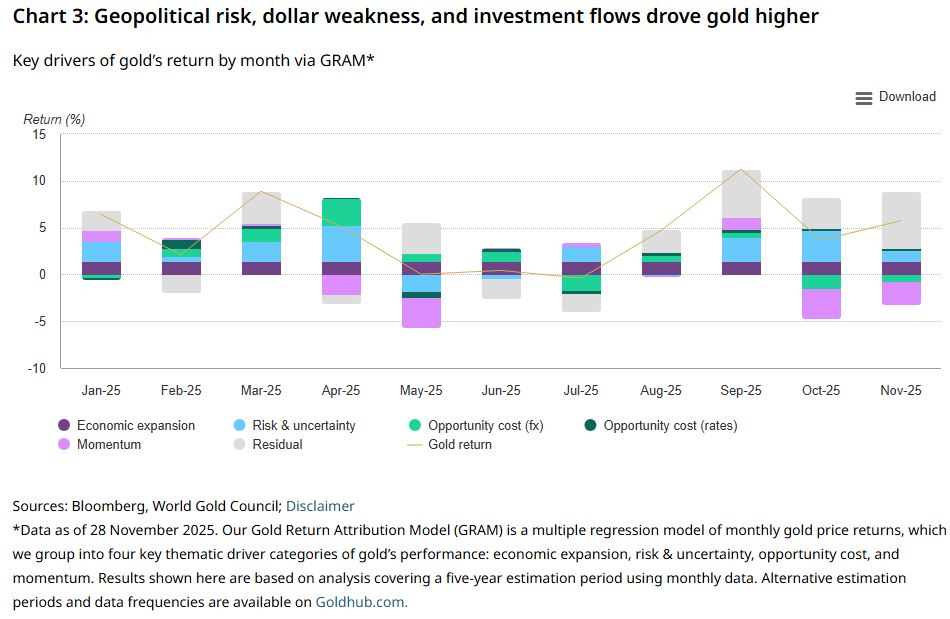
Notably, the contributions of the four main factors that drive gold have been unusually balanced this year (Table 1). This signals a market driven by diverse forces rather than a single catalyst. Having said that, momentum has played a larger role than in previous years, which is not surprising considering how gold’s strong rally has prompted widespread investor interest.
Table 1: Gold was driven in almost equal measure by its four key drivers
Return contribution from key gold drivers by year (%)*
| Category | Metric | 2025 | 2024 | 2023 |
| Risk & uncertainty | GPR risk | 8 | 3 | 1 |
| Other | 4 | 2 | 2 | |
| Opportunity cost | FX risk | 8 | 5 | 2 |
| Other | 2 | 2 | 2 | |
| Momentum | 9 | 3 | 2 | |
| Economic expansion | 10 | 5 | 3 | |
| Total above | 41 | 20 | 12 | |
| Other factors** | 20 | 6 | 3 | |
| Gold total return | 61 | 26 | 15 | |
*Data as of 28 November 2025. Numbers may not add up to total due to rounding. Figures are shown as a % and represent the percent contribution to gold’s return by year. For more information on our Gold Return Attribution Model (GRAM) please see Chart 3.
**Other factors not included in the model, due to data availability (such as central bank purchases), transient effects, or analysis limitations.
Source: World Gold Council
What to expect in 2026
Looking ahead to 2026, markets are largely pricing in a continuation of the status quo, but divergences in macro data laden with a heavy geoeconomic blanket, mean that uncertainty will remain high. Concerns about a softening US labour market are mounting, while debates persist over whether inflation will stay stubbornly high or face renewed upward pressure. At the same time, and despite some progress, geopolitical frictions continue to simmer.
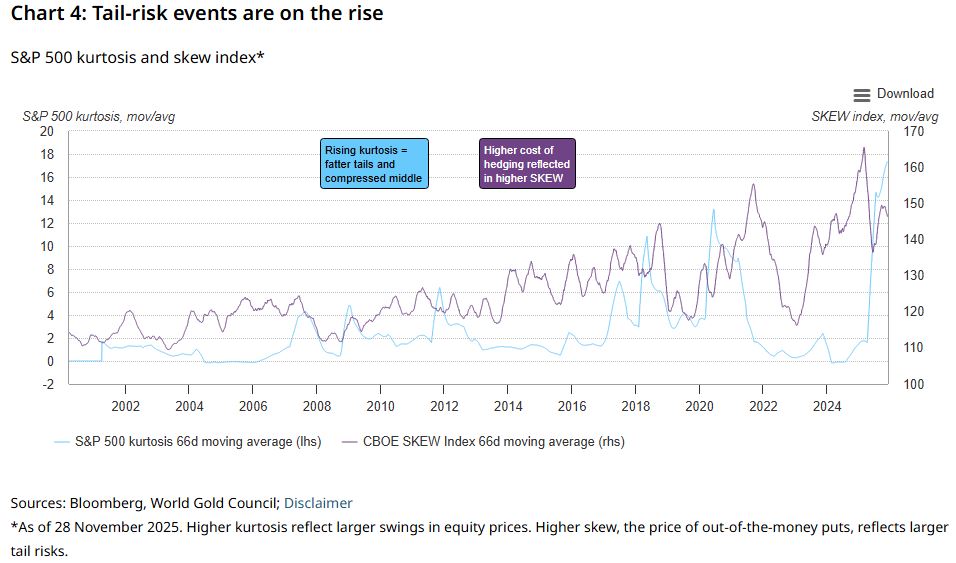
What does this mean for gold? Much like this year, unforeseen events – such as Liberation Day – are impossible to anticipate. Still, while their exact nature is unpredictable, the frequency of tail risk events is on the rise (Chart 4).3 Whether such developments trigger risk-on or risk-off sentiment could play a decisive role in shaping performance across asset classes and gold’s role as a strategic diversifier.
What macro consensus tells us
The gold price today largely reflects macro consensus expectations related to economic growth, inflation, and monetary policy.4
This is captured by the rangebound performance shown by our Gold Valuation Framework when we input market consensus variables (Table 2). Namely:
- Global GDP growth remains stable and broadly in line with trend (2.7% – 2.8% y/y in real terms)
- Around 75bps of additional rate cuts from the Fed, and a core CPI/PCE fall of roughly 40–60 bps by year-end
- The US dollar edges higher, and yields stay broadly flat.
But, as history shows, the macroeconomy rarely follows the path that market consensus dictates.
As such, we analyse the conditions that would push gold moderately higher (a shallow slip), significantly higher (the doom loop), and those that would prompt a notable pullback (reflation return).
A shallow slip
US economic data has been mixed, but market participants are concerned that momentum may be slowing. As risk appetite declines, positioning shifts to defensive assets.
Within this environment, a potential reset in AI expectations could act as an additional drag on equity markets, especially since AI names carry significant weight in major indices, amplifying market volatility and encouraging further de-risking.
This may result in a softer US labour market as record-high margins contract, which would prompt weaker consumer activity and contribute to a broader global growth slowdown.
Against this backdrop, the Fed would likely cut rates beyond current expectations, easing policy in response to rising economic uncertainty and expectations of cooling inflation.
Impact on gold: moderately bullish
The combination of lower interest rates and a weaker dollar paired with heightened risk aversion would create a continued supportive environment for gold.
Our analysis shows that, in this environment, gold could rise 5% – 15% in 2026 from current levels,5 depending on the severity of the economic slowdown, and the speed and magnitude of the rate cuts.6
This would represent a solid return in a normal year, but following 2025’s strong performance, it would still be considered a noteworthy follow-up.
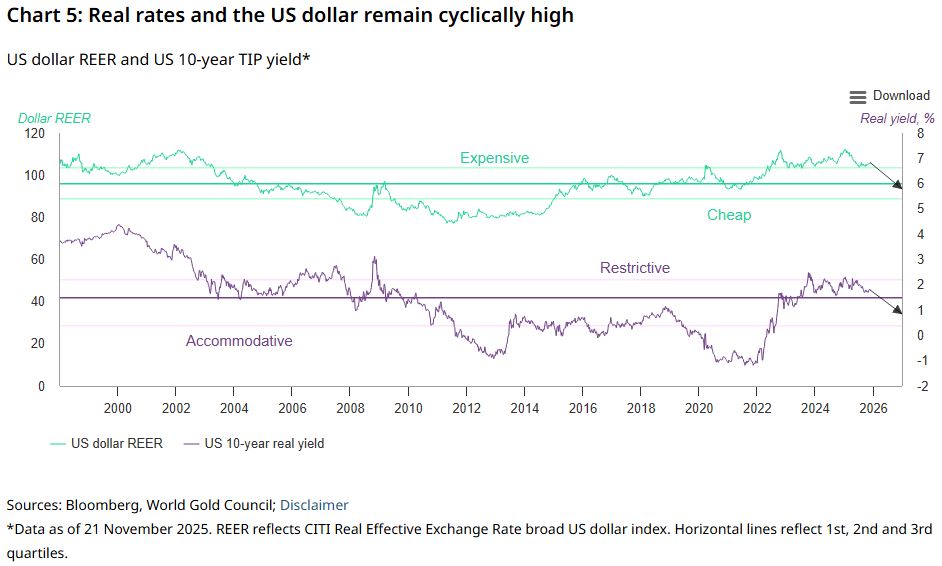
The combination of lower interest rates and a weaker dollar – both of which remain cyclically high (Chart 5) – have historically been a source of support for gold.
In addition, continued strategic central bank buying and potential new investment entrants, such as insurance companies in China or pension funds in India,7 could further support gold’s positive trend even if the economic environment remains relatively benign.
The doom loop
There is a non-zero chance that the global economy moves into a deeper and more synchronised slowdown,8 driven by rising geopolitical and geoeconomic risk. Tensions around trade, unresolved regional conflicts, or a new flashpoint may erode confidence and weigh heavily on global activity. These pressures would contribute to a more fragmented global environment and heighten risk sensitivity across trade and investment.
As confidence fades, businesses scale back investment and households pull back on spending, setting off a self-reinforcing “doom loop” that deepens the downturn. US growth weakens further, and inflation falls below target, prompting the Fed to cut rates aggressively. Long-term yields decline sharply, and the US dollar softens as policy eases, contributing to softer global trade and broad commodity weakness.
Impact on gold: bullish
This combination of falling yields, elevated geopolitical stress and a pronounced flight-to-safety would create exceptionally strong tailwinds for gold, supporting a sharp move higher. Under this scenario gold could surge 15% – 30% in 2026 from current levels.9
Investment demand, particularly via gold ETFs would remain a key driver, offsetting weakness in other areas of the market, such as jewellery or technology.
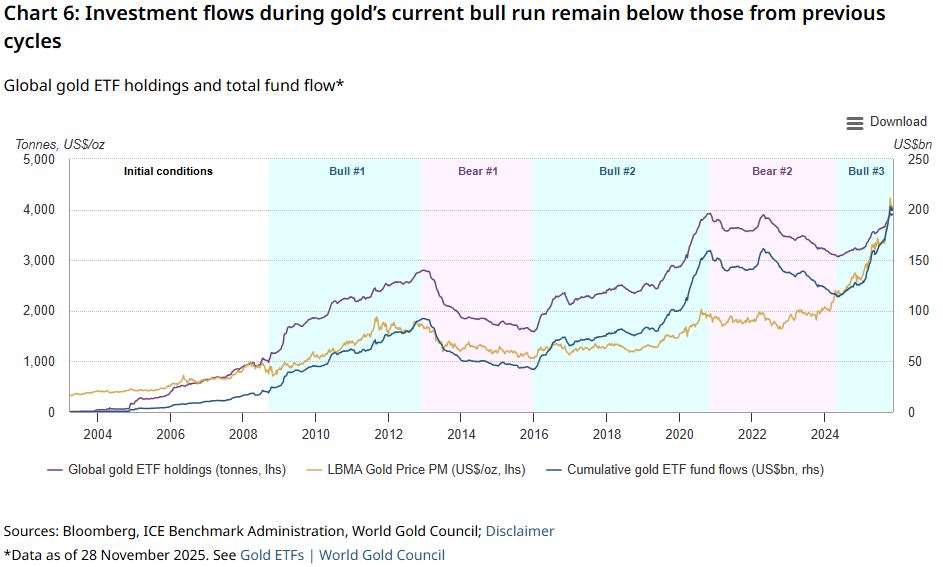
Rising prices have historically spurred investor interest, accelerating momentum. Global gold ETFs have seen US$77bn of inflows so far this year, adding more than 700t to their holdings.10 Even if we move the starting point back further to May 2024, collective gold ETF holdings are up by approximately 850t. This figure is less than half of what we have seen in previous gold bull cycles leaving ample room for growth (Chart 6).
Reflation return
On the flip side, there’s also a possibility that the policies set by the Trump administration succeed, resulting in stronger-than-expected growth linked to fiscal induced support. Under these conditions, reflation likely takes hold, pushing activity higher and lifting global growth toward a firmer trajectory. As inflation pressures mount, the Fed would be forced to hold or even hike rates in 2026.
This, in turn, would push long-term yields higher and strengthen the US dollar. The rise in yields and a firmer currency increase the opportunity cost of holding gold and draw capital back toward US assets. Improving economic sentiment would also fuel a broad risk-on rotation.
Impact on gold: bearish
Rising yields, a stronger dollar, and the shift toward risk-on positioning weigh heavily on gold, prompting a notable withdrawal of investor interest. With hedges unwound and retail demand softening, the backdrop turns decidedly negative, resulting in a gold price correction of between 5% and 20%, from current levels.11
Gold ETF holdings could see sustained outflows as investors rotate into equities and higher-yielding assets. Their magnitude would be a function of the reduction in gold’s risk-induced premium, which has been a mainstay since the invasion of Ukraine in 2022.
However, historical analysis also shows that opportunistic buying from consumers and long-term investors could act as a buffer in this kind of environment.
Despite this, the combination of higher opportunity costs, risk-on sentiment, and negative price momentum could create challenging conditions for gold, reinforcing this as the most bearish scenario in our outlook.
Wildcards
Beyond the scenarios outlined above, central bank demand and recycling supply are notable wildcards. These factors sit outside our traditional quantitative modelling for a few reasons but could materially influence gold markets.
Central bank demand remains a significant contributor to gold’s performance. Official sector purchases have been strong and there are good reasons to expect central bank buying to continue.
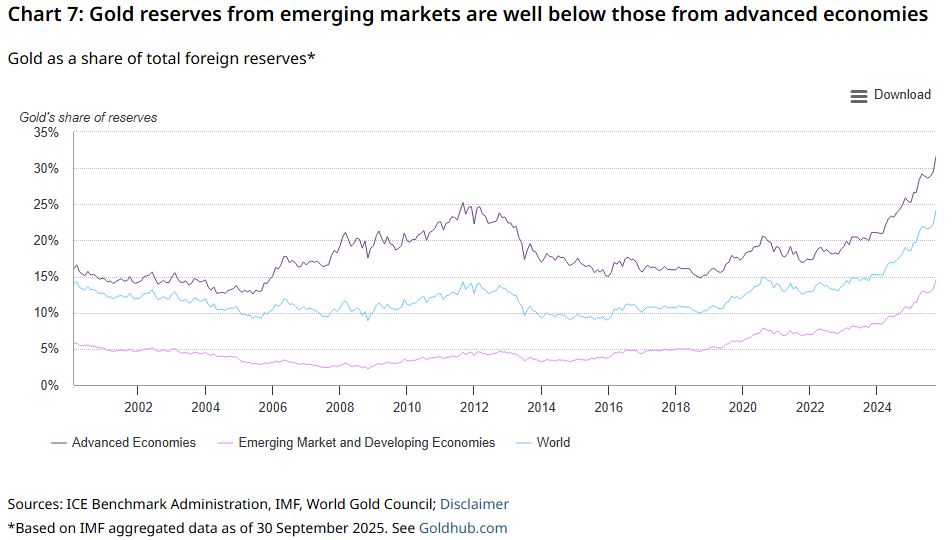
Gold reserves from emerging market countries, which are the main source of demand, remain well below those from developed countries (Chart 7). If geopolitical tensions escalate, EM purchases could accelerate, reinforcing structural support for gold.
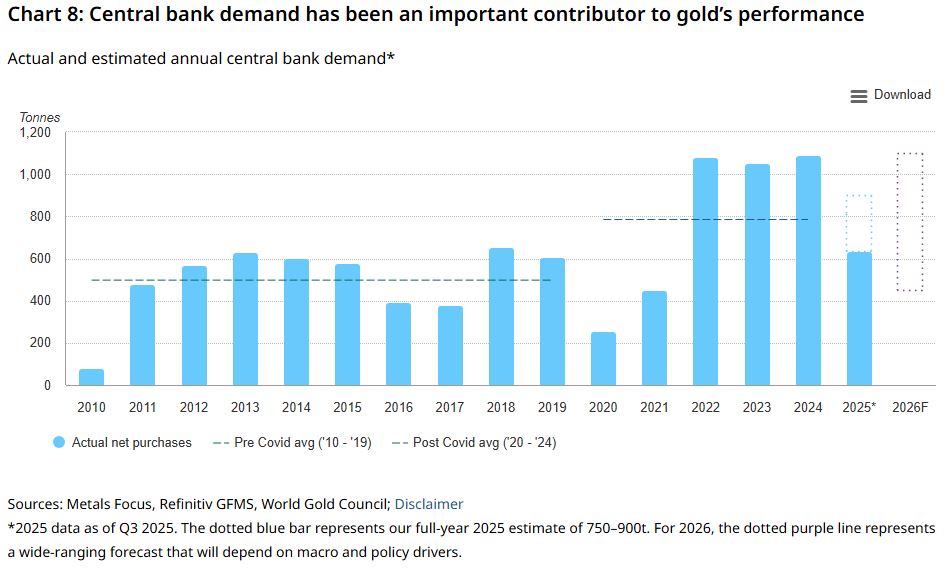
However, the decision process for central bank gold buying is often dictated by policy rather than market conditions alone. A significant pullback in purchases to or below pre-COVID levels could create additional headwinds for gold (Chart 8).
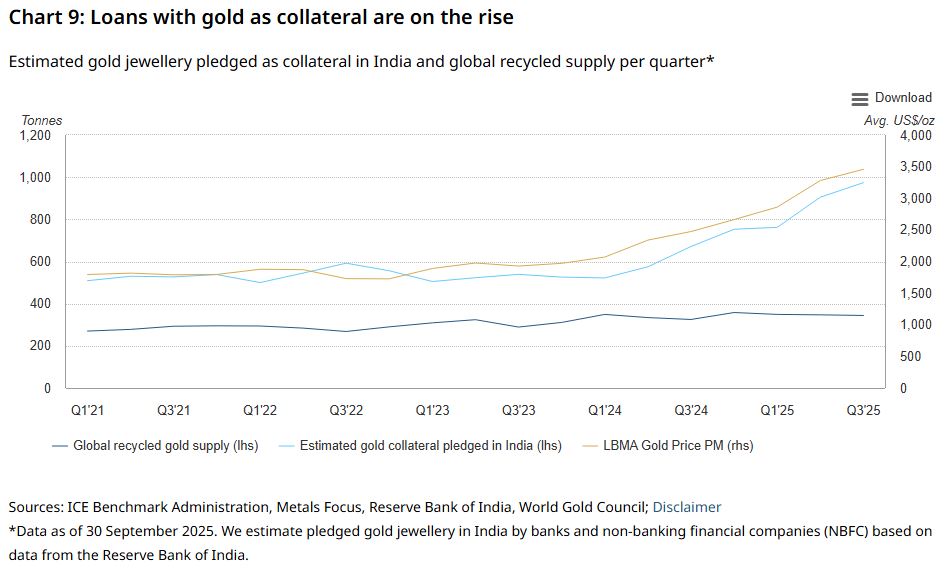
Recycling flows could also become a significant swing factor. Recycling has been relatively muted this year after accounting for factors such as the rise in the gold price and the effect of economic growth. This phenomenon has been linked to a notable increase in the use of gold as collateral for loans.
In India, consumers have pledged more than 200t of gold jewellery through the formal sector this year alone (Chart 9). And anecdotal evidence suggests there is almost as much gold backing loans from the informal sector.
If recycling remains subdued, with gold being used as collateral instead, it will continue to provide support. But a marked economic slowdown in India could trigger forced liquidations of gold-backed collateral, boosting secondary supply and adding pressure to prices. And while there is a widespread positive perspective for India’s economy, a severe global downturn – such as the Doom loop scenario – could create a spillover effect.
Conclusion
Gold’s outlook for 2026 is being defined by the uncertain economic environment that investors currently face. And, just like 2025, the upcoming year may bring significant volatility across financial markets.
While the current gold price broadly reflects the prevailing macroeconomic consensus and suggests a rangebound performance, our analysis indicates that the forces of softer growth, accommodative policy, and persistent geopolitical risks are more likely to support gold than to undermine it.
Moreover, gold investment, which has been critical to this year’s performance, still has room to grow.
Despite the plausibility of a bearish scenario, it is likely that investors will maintain some exposure to gold given the unpredictability of current geoeconomic dynamics.
In addition to investment demand, central banks and recycling can provide additional support. But, under certain conditions they can also become headwinds.
Ultimately, the diversity of possible outcomes highlights the value of scenario-based planning. In a world where shocks and surprises are increasingly the norm, gold’s capacity to provide diversification and downside protection remains as relevant as ever.
Table 2: Gold responds to a combination of factors that influence its role as an asset
Hypothetical macroeconomic scenarios and their implied gold performance for 2026*
| Economic scenario | Current consensus | A shallow slip | The doom loop | Reflation return | ||
| Expected Fed funds rate | Current 3.75% - 4.00%; 75bps lower |
Current 3.75% - 4.00%; 120bps lower |
Current 3.75% - 4.00%; 175bps lower |
Current 3.75% - 4.00%; 25bps – 50bps higher |
||
| Opportunity cost | 10yr yields: stable | 10yr yields: fall 30 – 40bps | 10yr yields: fall by more than 100bps | 10yr yields: rise by at least 20bps | ||
| USD: slightly higher | USD: flat to lower | USD: downside pressure | USD: moves materially higher | |||
| Economic expansion | Stable trend global growth | Global growth slightly slows | Global growth materially slows | Strong reflation; global growth up 3% | ||
| Risk and uncertainty | Inflation flat | Inflation drops by c.30bps | Inflation falls below 2% | Inflation rises by more than 1% | ||
| Neutral risk positioning | Risk-off positioning | Broad risk-off positioning | Risk-on positioning | |||
| Geopolitical risk elevated but stable | Geopolitical risk spikes then falls | Geopolitical risk spikes | Geopolitical risk falls | |||
| Momentum | Commodities flat | Commodities drop | Broad commodities sell off | Commodities rebound | ||
| Slight unwind of gold net positioning | Gold net positioning rises | Gold net positioning materially increases | Gold net positioning falls significantly | |||
| Implied gold performance | Rangebound | Moderately higher | Higher | Lower | ||
| Colour key (effect on gold): | Negative | Neutral | Positive |
*Data as of 28 November 2025. Hypothetical scenarios constructed based on Bloomberg consensus expectations, current market prices, Oxford Economics forecast, and historical performance. Impact on gold performance based on average prices as implied by the Gold Valuation Framework.
Source: Bloomberg, Oxford Economics, World Gold Council
Footnotes:
1Gold is up 60.6% based on the LBMA Gold Price PM as of 28 November 2025.
2We use 1971 as a starting point as it marks the end of the Gold Standard when gold became a freely traded asset again (see Why 1971?).
3BlackRock highlights 10 potential risks that could weigh on global political and economic relationships in the future. For more information, see: Geopolitical Risk Dashboard | BlackRock Investment Institute
4Consensus macro data provided by Oxford Economics.
6Performance implied by our Gold Valuation Framework based on the inputs shown in Table 2.
7India’s pension regulator plans to widen investment options for better returns, chairperson says, Reuters, September 2025.
8Probability of US Recession Predicted by Treasury Spread, Federal Reserve Bank of New York, November 2025.
9See Chart 1 and Table 2 for details.
10Indicative figure as of 30 November 2025. See Gold ETFs | World Gold Council.
11See Chart 1 and Table 2 for details.
This article is a re-post from here.
![]() Our free weekly precious metals email brings you weekly news of interest to precious metals investors, plus a comprehensive list of gold and silver buy and sell prices.
Our free weekly precious metals email brings you weekly news of interest to precious metals investors, plus a comprehensive list of gold and silver buy and sell prices.
To subscribe to our weekly precious metals email, enter your email address here.
Comparative pricing
You can find our independent comparative pricing for bullion and coins in both US dollars and New Zealand dollars which are updated on a daily basis here »
We welcome your comments below. If you are not already registered, please register to comment
Remember we welcome robust, respectful and insightful debate. We don't welcome abusive or defamatory comments and will de-register those repeatedly making such comments. Our current comment policy is here.