
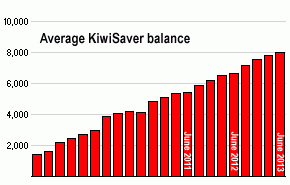
KiwiSaver members now have $17.2 billion invested in their schemes as at June 2013, data from the RBNZ reveals.
That represents 20% more per member than a year ago, from a combination of member contributions and investment returns.
The average KiwiSaver balance is now $8,013, up from $6,670 in June 2012.
The total funds invested grew more than 31% in one year, but membership grew at the same time by a bit over 9%.
(For comparison, the NZ Super Fund grew by 21.2% to $23.2 billion, although the government made no contributions. In KiwiSaver funds, members made regular contributions to the size of the fund.)
KiwiSaver fund managers have been progressively shifting these investments into overseas securities.
As at June 30, 2013, the overall components are now about 50:50, NZ and overseas. A year ago the ratio was 52:48. Five years ago, the ratio was 60:40, admittedly on a very small base because the KiwiSaver scheme had only just started.
The fastest growing allocation in the last year has been to overseas equities. More than $1.5 bln has been added to these investments, up 38% in a year.
Another big growth area has been NZ fixed income securities, up $838 million or more than 20% higher in one year.
Overseas fixed income and New Zealand cash deposits saw falling support by fund managers.
You can find how your fund is invested and how it performed over the past year, and more importantly over the past five years, here » and how it ranks against other funds here »
| June 2013 | June 2012 | change | ||||
| $ mil | share | $ mil | share | $ mil | growth | |
| Total KiwiSaver funds | 17,203 | 13,117 | 4,086 | 31.2% | ||
| of which | ||||||
| invested in NZ | 8,682 | 50.5% | 6,859 | 52.3% | 1,823 | 26.6% |
| invested overseas | 8,520 | 49.5% | 6,257 | 47.7% | 2,263 | 36.2% |
| NZ deposits | 1,502 | 8.7% | 1,324 | 10.1% | 178 | 13.4% |
| NZ Govt securities | 912 | 5.3% | 676 | 5.2% | 236 | 34.9% |
| NZ fixed income securities | 4,105 | 23.9% | 3,267 | 24.9% | 838 | 25.7% |
| NZ equities | 1,647 | 9.6% | 1,239 | 9.4% | 408 | 32.9% |
| NZ property | 510 | 3.0% | 348 | 2.7% | 162 | 46.6% |
| Other NZ assets | 6 | 5 | 1 | 20.0% | ||
| Overseas fixed income | 2,771 | 16.1% | 2,115 | 16.4% | 616 | 28.6% |
| Overseas equities | 5,512 | 32.0% | 3,956 | 30.2% | 1,556 | 39.3% |
| Other overseas assets | 237 | 1.4% | 146 | 1.1% | 91 | 62.3% |
Data sourced from RBNZ C15 release
New Zealand fund managers also have another $22.2 billion invested in non-KiwiSaver superannuation schemes, $40.2 billion invested in unit trusts, and $5.9 billion in life insurance funds. These other funds grew by +10.3% in the year to June 2013.
We welcome your comments below. If you are not already registered, please register to comment
Remember we welcome robust, respectful and insightful debate. We don't welcome abusive or defamatory comments and will de-register those repeatedly making such comments. Our current comment policy is here.