Because there is no industry-agreed standard or government regulation governing how KiwiSaver funds report their performance, we show two types of performance reporting.
1. The latest 'as-reported' by the fund itself which is usually after fees and before tax and is shown on the fund profile page (see here to locate your Fund), and
2. interest.co.nz's Adjusted Performance measures which give a much better way to compare performance between funds and appear in our comparison tables.
Our Adjusted Performance figures deduct those fees and expenses not included in the fund's reported returns, in a standard and consistent way. They include the fixed dollar 'membership' fees that almost all funds charge. To turn this into a percentage fee we have used a balance of $10,000. See here for more on fees and expenses.
They will be updated as at the last quarter end when we have a sufficient number of returns in.
The 'extra return' effect of Government and employer contributions are not included in both reported and calculated returns.
Ideally returns should be reported after tax as that is what you actually get and tax management is part of investment management the data for after-tax results are not available.
The returns we show will not be the returns any individual investor gets as your own return depends on ...
- when you invested, and
- the level of income tax (based on your own PIR) that is deducted; see here for more on tax and PIR rates.
What they do offer is a means of comparing performance. It is important to note that past performance is not indicative of future performance and is not guaranteed.
To see how a fund stacks up in comparison to others of the same type (see here for some words on fund types), we have provided a chart at the top of each fund type table. Here is the one for moderate funds.
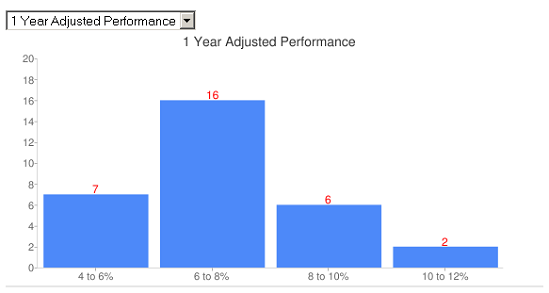
So you can see that the 1 year Adjusted Performance varies from between 4%-6% per annum to 10%-12.% with the bulk in the 6%-8% range.
You can also choose 2 and 3 year figures. The longer a fund performs well the better. Short term performance is less of a valid guide.
3 Comments
Hello
These are really good tables. Are these figures as at 31/3/2011? How often are these updated?
Superlife's posted performance are after tax, so your comparison is not valid for them with the pre-tax returns of others.
Thanks for this regular documentation update. You can spend some time playing Vampire Survivors after reading this article. You will feel more comfortable playing it.