

According to the latest data, banks are lending $110.9 bln more than they have in customer deposits.
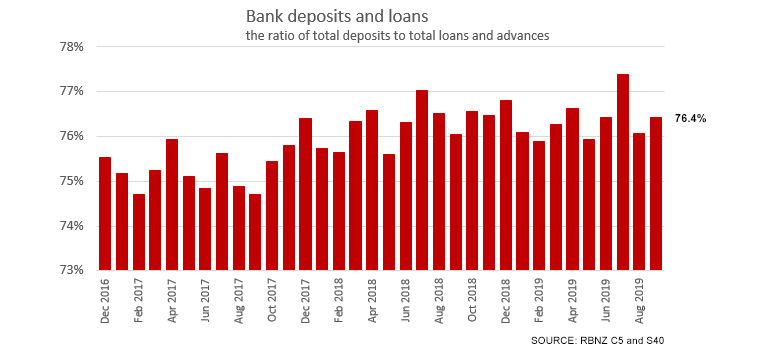
While that seems a lot, given that total loans and advances of all banks is now $470.1 bln and the total of all banking system deposits are $359.2 bln, the ratio between the two is 76.4%.
And at that level, things have been improving for the past two years; in September 2017 that same ratio was 74.7%.
But it gets interesting when you look at just households.
Depending on how you look at it, households are either much bigger borrowers, or have much lower deposit levels than the average across the whole economy.
In fact, of that $110.9 overall shortfall, $105.2 bln of that is for households alone.
And that means banks lend to business, agriculture (and government agencies) about the same amounts as they have in their deposit balances. All the loan-to-deposit shortfall is by the household sector.
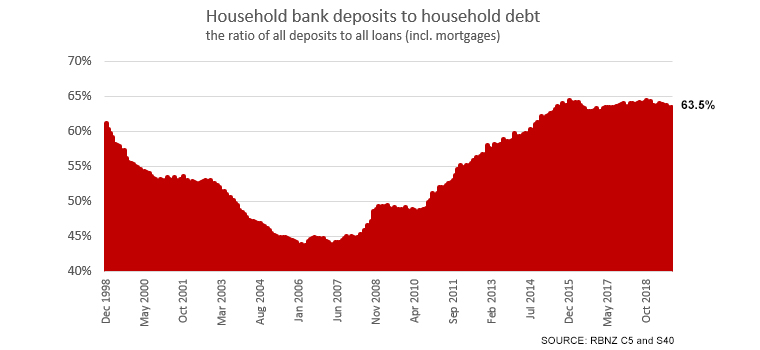
Fortunately for us, the improvements from 2008 not only made back the earlier backtracks, they built in additional catchup.
But in the past few years, those ratio improvements haven't been maintained. So now the dollar values of this discrepancy are rising again.
Over a longer run, this ratio has improved substantially, especially until 2015 when the improvement petered out. However, the real issue was the period 1998 to 2008 when matters got substantially worse. (And interestingly, these shifts seem to coincide with different government terms.)
And we can see it happening monthly again as household deposit growth slows in the S40 series, now rising at its slowest pace in almost a decade, while household debt growth picks up, now rising at its fastest in 24 months (C5).
We welcome your comments below. If you are not already registered, please register to comment
Remember we welcome robust, respectful and insightful debate. We don't welcome abusive or defamatory comments and will de-register those repeatedly making such comments. Our current comment policy is here.