
This content was the Special Topic in the November Monthly Economic Indicator report issued by The Treasury
The recession and recovery of 2008-13 can be compared with previous New Zealand recessions and recoveries, and with those in other countries.
Data lags and revisions mean that the interpretation of business cycle developments can change over time.1
The dating of real GDP recessions and recoveries matters for interpretation
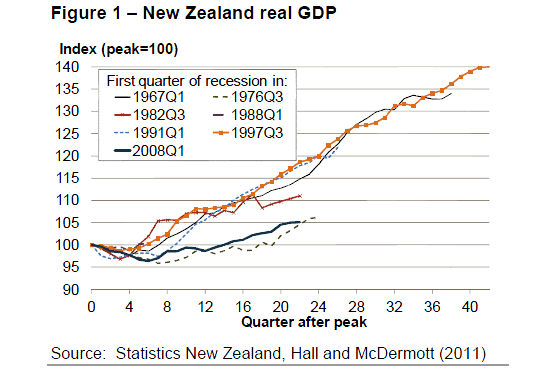
Figure 1 shows the path of New Zealand’s real GDP over 2008-13 compared with previous New Zealand recessions that began in 1967, 1978, 1982, 1988, 1991 and 1997.2
The method used to identify the timing of New Zealand’s past recessions comes from a paper by Viv Hall and John McDermott.3
They use a statistical method to identify turning points in real GDP rather than the commonly used ‘technical recession’ criterion of two consecutive quarters of negative growth.4
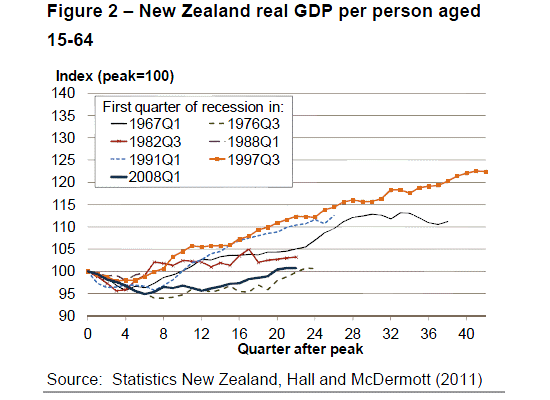
Demographic factors that impact on working-age population growth may complicate comparisons across time.
Figure 2 presents comparisons for real GDP per person aged 15-64 (as a proxy for the working-age population).
Population estimates are only available annually before 1991, so quarterly estimates for this period are the result of interpolation.
Adjusting for working-age population does not change the picture much, although it means there are greater differences in the recovery paths following recessions that began in 1967, 1982, 1991 and 1997.
Initial recession phase in 2008 was in line with the average of past New Zealand recessions
In the first three quarters of 2008, real GDP fell in line with the average of past recessions in New Zealand. Indeed, in this initial phase, the recession was less severe than had been experienced in 1967, 1982 and 1991.
The initial phase of recession was before the global recession, driven by domestic factors of monetary tightening (in response to rising inflation and inflation expectations), sharply exacerbated by severe drought in late 2007 and early 2008.
But the 2008/09 recession was deeper and longer than the average
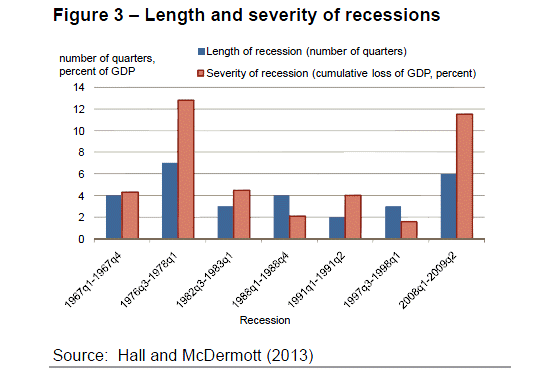
Hall and McDermott compare recessions by their length (number of quarters) and overall severity.
Severity is defined as cumulative GDP loss and is therefore a measure which reflects both duration and depth.
Figure 3 shows that the recession in 2008-09 was the second longest and most severe in this sample behind the 1976-78 recession.
The Lehman Brothers bankruptcy in September 2008 and consequent global recession coincides with the divergence in the path of real GDP from the average of past recessions.
The recovery has been U-shaped, which looks similar to the 1976-82 cycle
Most of the previous recoveries look V-shaped, with reasonably fast, positive growth returning after three or four quarters of recession(although recovery following the 1991 recession took longer to take hold).
In contrast, the most recent recession/recovery cycle liiks decidedly 'U-shaped', similar to that of the 1976-82 cycle.
In the second half of 2010 there were two consecutive quarters of negative real GDP growth, meeting the definition of a technical recession. This further delayed the recovery.
Part of the reason for the U-shaped cycle is no doubt the unusual set of domestic and global shocks that have negatively impacted domestic and external demand (i.e. consumption, investment and exports).
However, comparisons with the 1970s raise the question of whether there are also supply-side explanations for the slow recovery. Earthquakes and drought are obvious supply-side factors.
We have also observed lower productivity growth over the 2000s and the RBNZ and Treasury have both downgraded potential growth expectations post GFC as a consequence. There has been international debate about the extent to which the supply side has been damaged by insufficient aggregate demand.
International comparisons show real GDP performance similar to the US
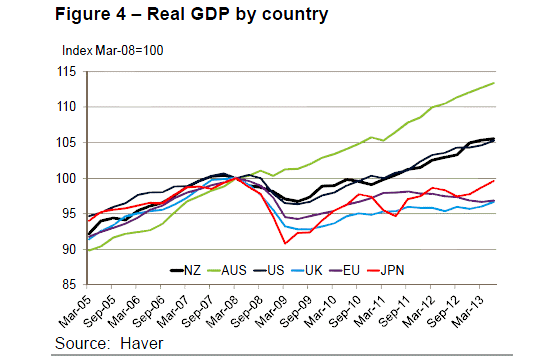
Figure 4 shows the path of real GDP indexed to March 2008 for New Zealand, Australia, US, UK, EU and Japan.
There are noticeable differences in performance.
Australia continued to grow throughout the GFC, partly helped by a large fiscal stimulus and strong demand from China for hard commodities. Europe, UK and Japan had severe recessions and very slow recoveries.
New Zealand and the United States are in between, with somewhat less severe recessions than in UK, Europe and Japan followed by gradual recoveries.
The reasons for the divergence in performance across countries are debated.
Differing degrees of monetary, fiscal and exchange rate flexibility, as well as the relative size of and damage sustained by each country’s financial sector, are undoubtedly a large part of the story.
The different experiences highlight the critical role of well-functioning banking systems in modern economies.
This analysis has been confined to real GDP. Of course, other variables matter. In particular, the cost of recessions is particularly related to its impact on employment.
While New Zealand’s real GDP performance has been strikingly similar to the US, the employment situation has been different.
In New Zealand the unemployment rate rose from 3.5% to 7% (now 6.2%), while in the US it rose from 5% to 10% (now 7.3%).
Overall, New Zealand has had a severe recession and slow recovery but it is comparable to historical and international experience
This analysis has shown that the 2008-09 recession has been New Zealand's second longest and most severe since the mid 1950s (after that of 1976-78). The recovery has also been the second slowest to recover to the pre-recession level of real GDP in both aggregate and per capita terms.
New Zealand's experience has not been unusual and our performance is similar to the US, better than the UK and Europe but compares less favourably with Australia.
-----------------------------------------------------------------------------
1 Indeed, expected revisions in the forthcoming September GDP release mean that there are likely to be some differences in the measured pace of the recent recovery from the current vintage of data.
2 We have excluded from this analysis the period before 1955 due to concerns about data quality. Further discussion of the estimates is in Viv B. Hall and C. John McDermott (2011) “A quarterly post-Second World War real GDP series for New Zealand”, New Zealand Economic Papers, 45:3, 273-298.
3 Viv B. Hall and C. John McDermott (2013) “Recessions and recoveries in New Zealand's post-second world war business cycles”, 23 October 2013. http://www.victoria.ac.nz/sef/about/staff/pdf/HMcD-RecRec-23-Oct-2013.pdf
4 There are, of course, alternative ways to interpret the data. Brian Easton interprets New Zealand’s GDP per capita cycles through the lens of five ‘great stagnations’. See http://www.treasury.govt.nz/publications/media-speeches/guestlectures/easton-jul11.
We welcome your comments below. If you are not already registered, please register to comment
Remember we welcome robust, respectful and insightful debate. We don't welcome abusive or defamatory comments and will de-register those repeatedly making such comments. Our current comment policy is here.