
Content published as a Special Topic in the May Monthly Economic Indicator bulletin from Treasury.
----------------------
Australia’s 2015 Budget was delivered on 12 May, followed by the New Zealand Budget on 21 May. This special topic summarises the economic and fiscal outlooks presented in the two Budgets.
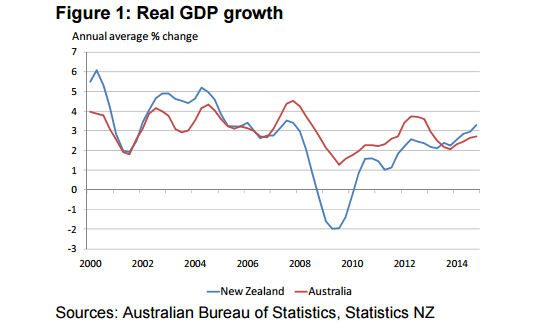
Australia’s economic growth is currently below its historical average
Australia’s average real GDP growth (3.0%) was higher than that of New Zealand (2.7%) over 2000- 2014, although economic cycles in the two countries have generally coincided. However, Australia’s growth has been below its historical average since early 2013 as it is gradually rebalancing from mining investment to private consumption and non-mining investment after a steep fall in the terms of trade from its peak in 2011.
In contrast, New Zealand’s recent growth has been above average as its terms of trade have been declining less sharply after reaching a lower peak in early 2014.
Also, New Zealand’s growth has been supported by strong private consumption and residential investment underpinned by the Canterbury rebuild and migrant inflows (Figure 1).
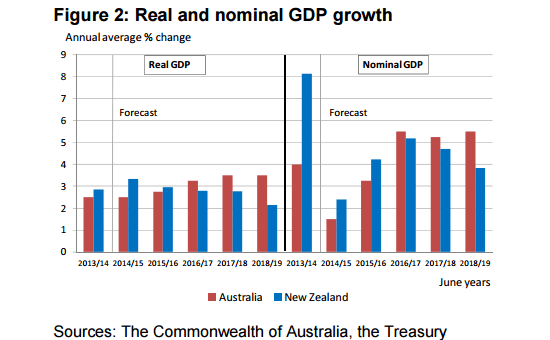
Australian Budget forecasts a delay in growth pick-up
The Australian Budget forecasts show real GDP growth accelerating from 2.5% in 2014/15 to 3.5% in 2017/18 (June years).
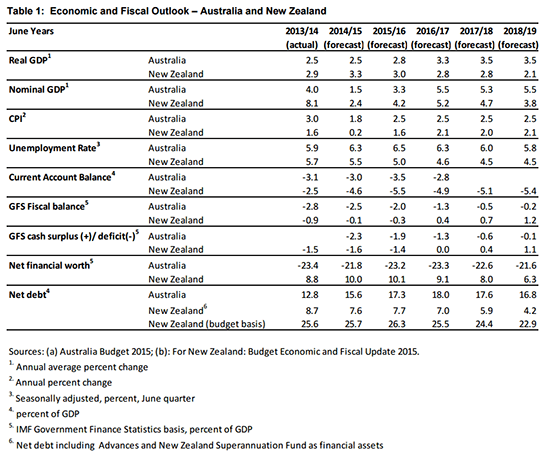
On the other hand, New Zealand’s Budget forecasts real GDP growth to ease from 3.3% in 2014/15 to 2.1% in 2018/19 (Figure 2 and Table 1 at the end of this topic).
The growth forecasts in the two Budgets reflect the different stages of their respective economic cycles. Australia’s growth is projected to increase as non-mining investment and private consumption strengthen to offset the fall in mining investment.
In contrast, New Zealand’s growth is likely to moderate as the Canterbury rebuild peaks and population growth eases back closer to historic norms. Both budgets contained downward revisions to the short-term growth outlook from the respective mid-year forecasts.
Australia’s nominal GDP growth forecasts (the main driver of government revenues) remain lower at 1.5% in 2014/15 and 3.3% in 2015/16 than New Zealand’s nominal GDP growth forecasts of 2.4% and 4.2% in those years. Both have significantly revised down the forecasts for 2015/16.
Australia’s downward revision reflects the weaker outlook for commodity prices and subdued growth in wages. New Zealand’s lower nominal growth forecast reflects a softer inflation outlook.
In the following three years, Australian Budget forecasts show nominal GDP growth stabilising around 5.5%, while New Zealand’s nominal GDP growth is forecast to moderate from 5.2% to 3.8%. This reflects higher real GDP growth and higher CPI inflation in Australia’s forecasts (See Table 1 at the end of this note).
Australia forecasts a decline in unemployment rates from 2016/17
Based on the latest forecasts, the rebalancing of Australia’s growth from mining-led growth to more broad-based expansion may take more time than was expected earlier. Non-mining business investment recovery is now expected to be delayed until 2016/17. Low interest rates and oil prices, as well as the lower exchange rate, are expected to support increases in dwelling investment, household consumption and exports.
Australia’s real GDP is expected to grow higher than trend from 2017/18, leading to absorption of spare capacity by 2021/22.
In contrast, New Zealand’s Budget forecasts assume the economy is already operating close to capacity and real GDP growth will moderate as capacity pressures develop.
As a result, Australia’s unemployment rate is forecast to reach a peak of 6.5% in 2015/16 and then decline to 5.8% in 2018/19. New Zealand’s unemployment rate is forecast to decline progressively from 5.5% in 2014/15 to 4.5% in 2018/19 (Table 1).
Australia’s fiscal consolidation projected to continue despite deteriorating tax outlook
The Australian Budget shows deterioration in the fiscal outlook from that presented in the 2014 MidYear Economic and Fiscal Outlook (MYEFO). The underlying cash balance, Australia’s preferred budget balance target, is forecast to show larger deficits compared to MYEFO. Nonetheless, the underlying cash deficits are forecast to reduce steadily from 2.1% of GDP in 2015/16 to 0.4% in 2018/19 before returning to surplus in 2019/20, as projected in the MYEFO. Modest surpluses are projected thereafter, reaching 0.4% of GDP by 2025/26, which is below the Australian Government’s target of 1%.
Australia’s deteriorating fiscal outlook compared to the MYEFO reflects lower tax revenue forecasts on account of lower nominal GDP growth. Nonetheless, policy decisions announced in the Budget are expected to produce net savings, which are likely to marginally offset the lower forecast tax revenues. The Budget seeks to fund tax relief for small businesses through previously held provisions. The enhanced compliance programme for Goods and Services Tax (GST) is expected to increase tax receipts over the five years to 2018/19. The Budget has also announced measures for ensuring “fairness” of the tax and benefits systems so that foreign companies pay their “fair share” of the tax burden in Australia, which is also likely to improve the budget position.
Accordingly, the total receipts/GDP ratio is forecast to increase from 23.5% in 2014/15 to 25.2% in 2018/19 (Figure 3). New Zealand’s Budget forecasts show core Crown revenue rising marginally from 30.0% of GDP to 30.6% over the same period mainly as a result of fiscal drag as more workers move into higher average tax rates.
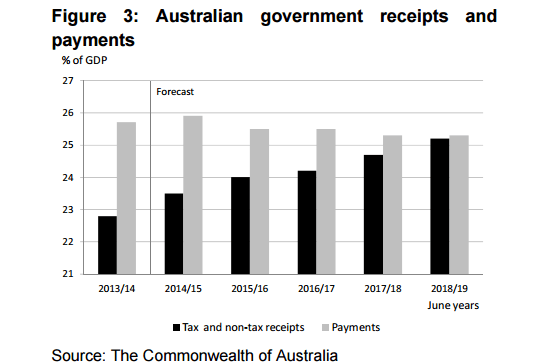
Australia seeks to reprioritise spending to new areas identified in the Budget while forecasting the total payments-GDP ratio for the Government to reduce from 25.9% in 2014/15 to 25.3% in 2018/19. New Zealand’s Budget forecasts show core Crown expenses decreasing from 30.5% to 29.2% of GDP over the same period.
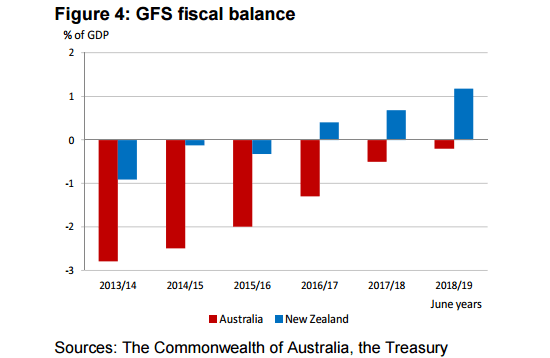
Respective forecasts for comparable fiscal indicators show New Zealand returning to fiscal surplus earlier than Australia
Australia’s headline fiscal indicators are not directly comparable to New Zealand’s because Australia compiles its Budget on an IMF Government Finance Statistics (GFS) basis, while New Zealand reports on a Generally Accepted Accounting Practice (GAAP) basis. However, to assist with international comparisons New Zealand also produces high-level GFS accounts.
Table 1 presents fiscal indicators for both countries for the central government compiled on a GFS basis. Australia is forecast to remain in fiscal deficit until 2018/19, while New Zealand is forecast to return to a fiscal surplus by 2016/17 (Figure 4). Notably, however, comparing even GFS-based fiscal indicators between the two central governments may not be appropriate in some respects because the States in Australia undertake significant amounts of government spending unlike in New Zealand where the bulk of the spending is by central government.
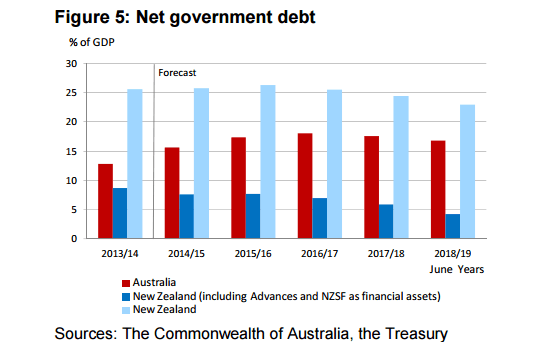
In addition, the provision of some services such as health and education by the public and private sectors in the two countries may explain some of the difference in government revenue and expenditure ratios. Australia’s net debt is forecast to reach a peak of 18.0% of GDP in 2016/17 and then decline to 16.8% in 2018/19.
However, Australia’s net debt is not directly comparable to New Zealand’s net core Crown debt used as the basis for the Government’s debt target. Unlike Australia, New Zealand’s net debt target measure excludes financial assets such as advances and those held by the New Zealand Superannuation Fund (NZSF) as they are considered ring-fenced for fiscal policy purposes.
Calculating net debt on a broadly comparable basis for New Zealand, net core Crown debt (including advances and NZSF as financial assets) is forecast to decline steadily from 7.7% of GDP in 2015/16 to 4.2% in 2018/19 (Figure 5).
We welcome your comments below. If you are not already registered, please register to comment
Remember we welcome robust, respectful and insightful debate. We don't welcome abusive or defamatory comments and will de-register those repeatedly making such comments. Our current comment policy is here.