
New analysis from the RBNZ allows us to see how our banking system works and where their lending activity is focused.
Banks are only as stable as their loan books, and although we can't get a look directly in those, the RBNZ does demand a level of transparency from these huge institutions and it shares some of that in their public releases, in aggregate.
The 'top level' of lending is revealed in their new S31 monthly release.
Banks have loaned a total of $409.8 bln to their customers as at the end of February.
And that shows more than half of all lending is for housing. It dominates bank lending.
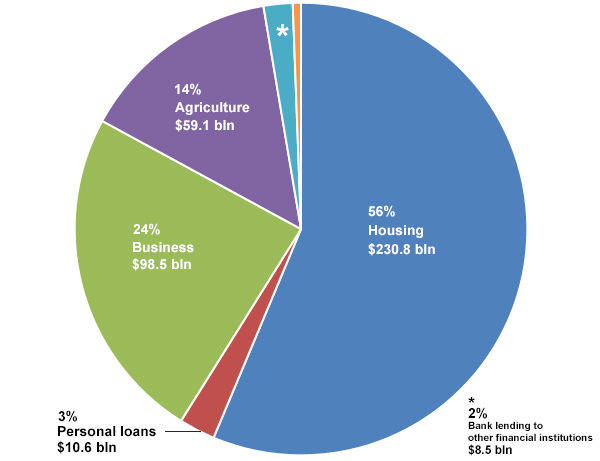
The new S31 release also reveals the split between loans to owner-occupiers, and separately for residential property investment.
The above pie chart is for data as at February 2017, but we don't have data for individual banks as at that date. But we do for December 2016 which allows us to drill into which banks are holding these loans.
| Total loans |
Housing loans |
Market share |
Housing concentration |
|
| as at December 2016 | NZ$ bln | NZ$ bln | % | % |
| Gross loans | ||||
| ANZ | 122.3 | 73.9 | 32.3 | 60.4 |
| ASB | 76.4 | 50.2 | 22.0 | 65.7 |
| BNZ | 76.2 | 35.7 | 15.6 | 45.9 |
| Kiwibank | 17.5 | 15.3 | 6.7 | 87.4 |
| Westpac | 76.2 | 45.6 | 19.9 | 59.8 |
| all other banks | 39.0 | 7.9 | 3.5 | |
| ----------- | -------- | -------- | ||
| RBNZ totals (S31) | $ 407.4 | $ 228.6 | 56.1% | |
| of which property investors are | $ 66.1 | 28.9% | ||
| Lending to owner/occupiers is | $ 162.5 | 71.1% | ||
Of the main retail banks, only BNZ has a 'real bank' spread of loans between sectors. All the other majors are essentially mortgage banks with excessive exposure to the housing markets.
It wasn't always this way. Banks have shifted from having balanced lending books to the current distortion in two phases. (Data from RBNZ G3.) The first shift started in the early 1990s when mortgage lending moved from about a third of bank loan looks to about a half. The second shift started about 2004 and took it up another five percent.
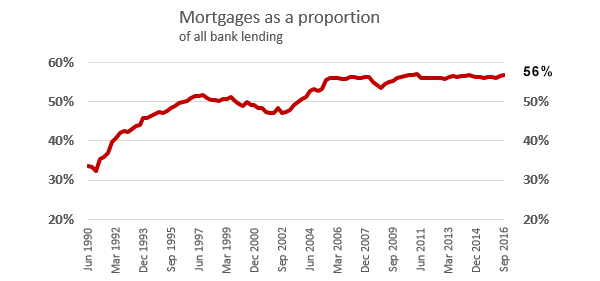
Over the 27 year period 1990 to 2016, mortgage lending grew by more than 14 times. In the same period, lending to businesses (including agriculture) grew by a little more than five and a half times in current dollar terms. In real terms it will have been much less.
You can't help wondering what our economy would look like today if banks had prioritised and supported the productive economy in the way they have the housing markets.
We welcome your comments below. If you are not already registered, please register to comment
Remember we welcome robust, respectful and insightful debate. We don't welcome abusive or defamatory comments and will de-register those repeatedly making such comments. Our current comment policy is here.