

For all that talk of winners in this year's Budget, a deep dive into the numbers coupled with fundamental economic analysis paints a different picture.
Those wanting to dig a bit further into the Budget numbers, here are some tools to see how 2017’s numbers compared to previous years, and what levels of spending we’re set to see over the next four.
First, interest.co.nz has compiled a quick summary of all spending plans announced in Budget 2017. You can access that page here. And see our tax collection plan here.
Second, a very welcome addition to this year’s debate comes from Victoria University school of government research fellow Toby Moore and NZIER Principal Economist and Head of Public Good Derek Gill.
They have combined forces to provide a wealth of tables on real and per-capita adjusted budget spending data since 1993, looking out through the Budget forecasts to 2021.
And I encourage interest.co.nz readers to go through the numbers – they show the actual story of government spending and priorities.
In particular, the tab on real (ie. Adjusted for inflation) per person core government expenditure is an important addition to the debate.
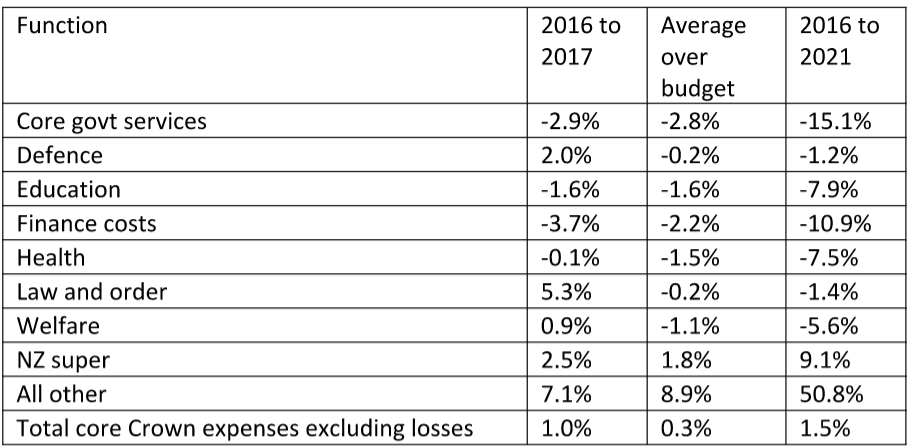
For example, it indicates, that from 2016 through to June 2021, real per capita…
- Core government services spending is set to fall 15%
- Defence spending is set to fall 1.2%
- Education spending is set to fall 7.9%
- Finance costs are set to fall 10.9%
- Health spending is set to fall 7.5%
- Law and order spending is set to fall 1.4%
- Welfare spending is set to fall 5.6%
- NZ Super spending is set to rise 9.1%
- All other expenses are set to rise 50.8%
It also includes nuggets like the weekly tax bill for the average taxpayer in 2016 vs 2021. Super costs jumps out as rising from $49.92 to $54.48 over that timeframe. That’s as the proportion of over-65s rises from 14.88% of the population to 16.37% (see the population tab).
And check out the Growth Rate (core) tab for comparisons of real per capita growth rates for spending classes between 2000 and 2009 and from 2009 onwards, against historical averages.
Why is this important?
The Treasury spending numbers in the Budget are always nominal – they tell us the amount government is expecting to spend on, say, health this year, next year, the year after that, and so on.
There is no adjustment for inflation. There is no adjustment for population growth. A 10% increase in something over that timeframe might in fact be negative when you take into account price rises and that there might be a greater number of people tapping government spending over the next four years.
Labour has promised to set up an independent Budget responsibility office. This project is not linked to that – it’s not political. But it might very well provide the first blueprint for how Budget documents might be held to account in future and discourage politicians from blathering on purely about nominal spending increases.
Here is what Vic Uni and NZIER have to say about the numbers:
Researchers at Victoria University of Wellington and the New Zealand Institute of Economic Research (NZIER) have found that while overall real per capita government spending is stable, a breakdown of new and projected Crown expenditure shows a significant transformation in the make-up of Government spending.
Education spending is projected to fall by 1.6% in the 2017 budget year, with spending falling relative to population and inflation by 7.9% by 2021.
Real per capita spending in health will fall slightly the coming Budget year (-0.1%), but over the forecast period is projected to fall to 7.5% below current levels by 2021.
Those areas seeing significant increases during the new Budget year include law and order (+5.3%), defence (+2.0%), and welfare (excluding New Zealand Superannuation) (+0.9%). However, all are projected to fall over the medium term as future operating allowances decrease.
Real per person spending on New Zealand Superannuation is set to increase steadily, with a 2.5% increase in 2017 rising to 9.1% above current levels in 2021.
Several smaller categories of spending have seen large increases in spending in 2017l, including economic and industrial services, transport and communication and environmental protection.
The attached table shows further breakdowns of real per capita spending changes.
Head of Victoria’s School of Government Professor Girol Karacaoglu says this analysis provides New Zealanders with a more accessible way to understand Government spending decisions.
“This Budget sets out a much-changed shape of the state when it comes to core services such as health, education and law and order, and it is important that New Zealanders have a solid understanding of what these changes mean in real, per capita terms.”
NZIER Principal Economist and Head of Public Good Derek Gill says the analysis will help put the spotlight on the quality of government spending.
“For example questions should be asked about the social return on the sharp increase in spending on law and order. Effective social investment would shift resources into the back-end of the justice system putting more effort in well targeted prevention rather than negative spending on the front-end of law and order system.”
*This article was first published in our email for paying subscribers. See here for more details and how to subscribe.
We welcome your comments below. If you are not already registered, please register to comment
Remember we welcome robust, respectful and insightful debate. We don't welcome abusive or defamatory comments and will de-register those repeatedly making such comments. Our current comment policy is here.