
Key points:
• Household borrowing has slowed considerably since the Global Financial Crisis, though the level of debt remains high.
• Most of this slowdown can be attributed to the softer housing market. Correspondingly, we expect household borrowing to accelerate as the housing market continues to warm up – albeit not on the scale of last decade.
• There is also some evidence of a broader decline in the appetite for debt. But even taking that into account household debt levels are likely to stay historically high.
The orginal article is here » and a copy is also attached below.
-----------------------------------------------------
By Felix Delbrück*
 One sign of just how much the domestic economic landscape has changed since the 2008/2009 recession is the remarkable decline in the pace of household borrowing.
In the decade before the Global Financial Crisis, household debt grew at an average pace of about 10% a year; by 2011 growth had slowed to a low of 1%, from which it has only just started to recover.
Even so, the level of household debt isn’t far below historic peaks, as a share of both household income and assets: much as in other countries that experienced housing booms before 2008, there hasn’t been that much actual ‘deleveraging’.
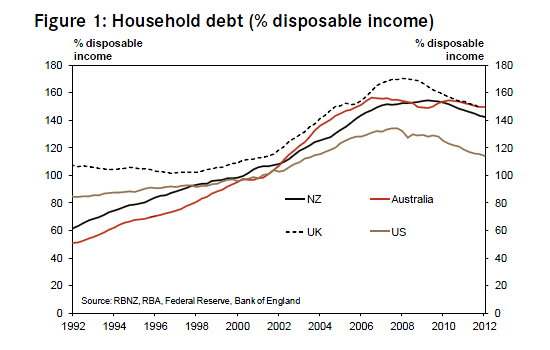
There’s been widespread concern about both the level of household debt, and about whether we’re seeing new ‘consumer caution’ in the wake of the recession. In this article – the second in a series on New Zealand’s household sector – we look at what drove the pre-financial crisis debt blowout, and how much further a correction might have to run. (In our first article, ‘Save us!’, we looked at some of the measurement issues around household saving; in a forthcoming article, we’ll sum up what this all means for household spending in the years ahead.1)
We find that we can attribute most of the ramp-up in household borrowing before 2008, and the slowdown since then, to what’s happened to the housing market – primarily to a collapse in housing turnover. We do find evidence of a broader decline in the appetite for debt in recent years, but it seems to have played a secondary role.
More recently, of course, the housing market has shown renewed signs of life, and with interest rates set to stay at historically low levels well into next year, we expect it to warm up further.
History therefore points to household debt growth picking up as well.
Even taking into account households’ more cautious attitude to debt, our forecasts imply a fairly gentle pace of further ‘deleveraging’.
That seems reasonable to us: unless we see a return to the high interest rates, constrained credit, and much lower house prices of the 1980s and 1990s, the level of household debt is likely to stay high by historical standards.
Equally, though, a repeat of the mid-2000s, when house prices more than doubled and housing turnover was almost twice as high as it is now, looks very unlikely.
We may not be in for large-scale debt reduction, but nor is another ramp-up in household debt on the scale of the last decade on the cards.
Why has household debt growth slowed?
In New Zealand, household debt by and large means mortgage debt. While credit card and other consumer credit also saw strong growth for much of the 2000s, and a steep retrenchment in the years after 2008, the vast bulk of household debt (over 90%) is secured on housing, and mortgage debt has been responsible for most of the ups and downs in household borrowing over the past two decades.
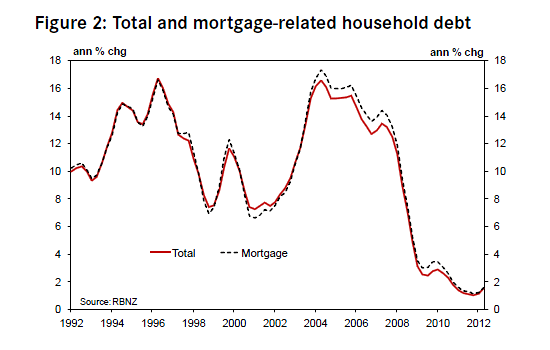
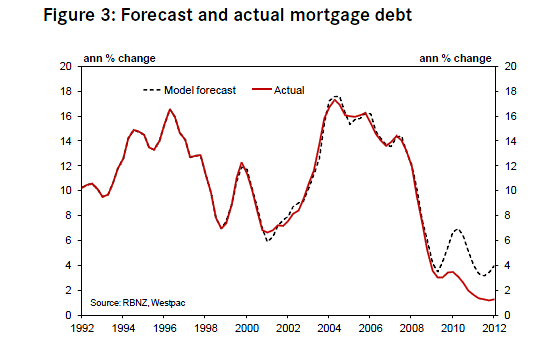
That suggests that household borrowing is intimately tied in with developments in the housing market. As we explain in the section at the end of this note, those links are complex and may well change over time. In practice, though, we find that a remarkably large part of the slowdown in mortgage borrowing over the past few years can be explained by the massive decline in housing turnover, and to a lesser extent the fall in house prices, that we’ve seen over that time.
That’s shown in figure 3, which compares growth in actual mortgage debt since 2008 to a forecast based on the level of house sales, the detrended mortgage rate, and the value of the housing stock. The model is estimated using pre-recession data, and fits well over that period (with house sales by far the most important driver). Since 2008, these pre-recession relationships would have predicted slower housing credit growth than at any time over the preceding 15 years.2
Other factors
While figure 3 attributes the lion’s share of the debt downturn we’ve seen to a slower housing market, it does suggest that that there’s been a persistent ‘extra’ slowdown in household borrowing in recent years that our model can’t explain. The gap is material, cumulating to about 9% by early 2012. What’s behind this gap, and how long might it last?
Credit conditions: One possible explanation is that the supply of credit – lending conditions – tightened in the aftermath of the Global Financial Crisis. However, the evidence is that this is steadily becoming less of an issue. For example, according to the RBNZ’s Credit Conditions Survey, lending standards for mortgages have eased back substantially since 2011. And the BNZ-REINZ Residential Market Survey has been showing a steady increase in interest from both investors and first-home buyers over the past year, suggesting a return of more leveraged buyers to the market.3
Slower house-building: Since the recession, the level of residential building consents has been unusually low compared to housing transactions. More than usual, demand has had to be met through existing rather than new houses - suggesting that we may have seen a greater degree of ‘churn’ in the market, with a correspondingly smaller net impact of turnover on debt. Given how closely house building and turnover usually move together, this factor is hard to isolate. But as the housing market continues to pick up, we’d expect recent ‘underbuilding’ to gradually diminish.
Faster debt repayment: It’s not clear that there has been a sea change in attitudes to repaying debt. According to the Westpac McDermott Miller consumer confidence survey more households are now saying they would use a lump-sum windfall to pay down debt than in the mid-2000s – but that looks more like a return to pre-housing boom conditions than a major shift.
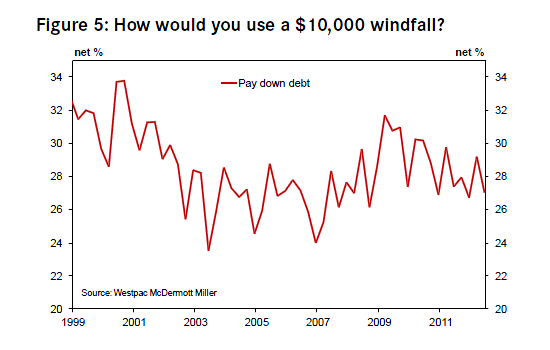
That said, one major ‘windfall’ has come in the form of lower interest rates. The average mortgage rate on outstanding loans has fallen by about a third since late 2008, and as a result borrowers have been able to pay off principal faster without making any changes to their debt payments. A recent survey of Australian households found that about 50% of households kept their interest payments unchanged when interest rates fell in 2008-2009. We estimate that ‘passive’ repayment on that scale would account for less than a third of the gap in figure 3.4
It’s also possible that some quake-related insurance payouts have been used to reduce mortgage debt – though we don’t know how much. The sum total is certainly substantial: about $4.5bn worth of insurance claims for the Canterbury earthquakes have been settled to date. But a decent chunk is likely to have simply been deposited.5
Appetite for debt: By a process of elimination, it seems likely that a decent chunk of the unexpectedly weak credit growth that we’ve seen is a sign of a more cautious attitude to debt. That would be in keeping with people’s continued downbeat assessment of their family finances in the Westpac McDermott Miller consumer confidence survey. It’s impossible to say how long it will last, but given ongoing volatility in global financial markets it could well be for some years yet.
Where to from here?
Over the past year or so the housing market has begun to show new signs of life: house sales are nearly 20% higher than a year ago, and prices have recovered to only a little below their 2007 peaks. With mortgage rates at historic lows, we expect prices to rise by a total of 15% this year and next, with a corresponding rise in housing turnover.
Even so, this doesn’t come close to the overheated conditions of last decade, and the implied increase in mortgage borrowing is fairly modest as well. That’s shown by Figure 6, which extends the model-based forecast we used in figure 4 over the next three years.6
We have little to go on to assess how long the ‘extra’ slowdown in debt that we’ve seen will last. However, it seems likely that credit growth will stay unusually weak for a while yet, as low interest rates continue to facilitate debt amortisation, and a more cautious attitude to debt feeds through the system. In figure 6 we’ve assumed that the gap closes slowly over the next couple of years, but we acknowledge that this is just an educated guess.
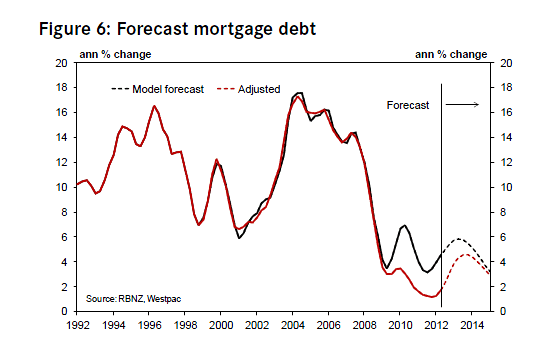
Even so, it’s worth noting that our forecasts in figure 6 imply a fairly gentle pace of ‘deleveraging’, with debt-to-income and debt-to-asset ratios not falling too much further from here. That doesn’t strike us as unrealistic.
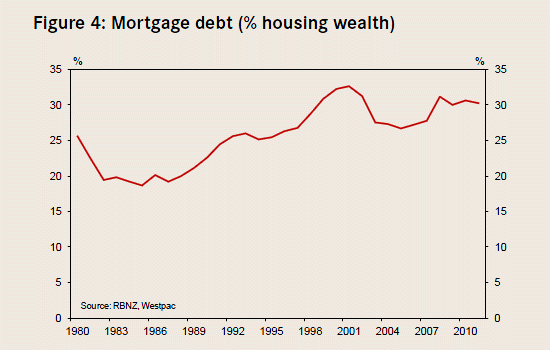
As shown in figure 4, the ratio of mortgage debt to housing wealth has been fairly stable since the late 1990s (well before the last housing boom), and it’s unlikely to fall back much further unless we return to the much tighter credit conditions, and lower house prices, of earlier decades – or unless the appetite for debt contracts much more than we’ve already seen. What’s more, with some people still living in houses they bought when prices were lower than they are now, there’s still scope for mortgage debt to increase once they eventually sell.
With interest rates having trended down since the early 1990s (partly a result of lower inflation) – and house prices correspondingly higher – debt is also likely to stay high as a share of incomes.
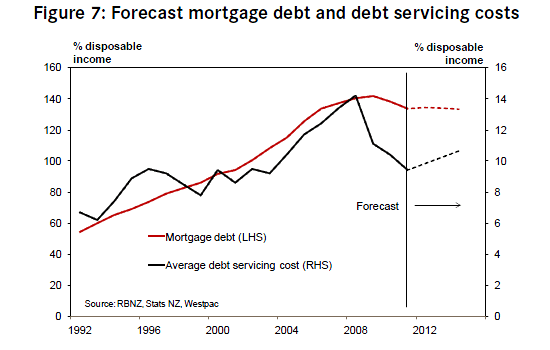
In fact, with mortgage rates currently at historic lows, interest costs (as a share of income) are already back to where they were in 2003, before the housing and credit boom got going. Even if (as we expect) mortgage rates eventually rise back to around 8%, this would still imply debt servicing costs well below their 2007 peak (figure 7).7
That means that debt can continue to be sustained at higher levels than in previous decades.
--------------------------------------------------------------------------------------------------------------------------------
Housing turnover and mortgage debt
One way to think about the link between mortgage debt and the housing market is to consider how the sum of housing market transactions affects mortgage debt. Clearly, not all house sales are created equal: many will simply be churn, where homeowners swap houses of similar value with little net change in debt.
But for everyone trading up, there will be someone trading down, and for every entrant to the market (first home buyers, migrants, or those adding to their rental property investment portfolio) there must, somewhere down the line, be someone either exiting the market (e.g. estate sales), or adding to the housing stock (e.g. property developers). On net these transactions will add to total mortgage debt provided the buyer takes on more debt than the seller pays down. This will depend on factors such as:
• the prevalence of first home buyers and rental property investors (who are likely to have relatively low equity in their purchase);
• the extent to which demand is being met by investment in new housing;8
• the size of buyers’ down-payments (due to changing lending standards or a greater or lesser appetite for debt);
• whether house prices have been rising or falling (rising house prices raise the amount that new buyers or those trading up have to borrow, without affecting the debt owed by sellers who bought when prices were lower).
Importantly, the link between housing market transactions and debt implies that changes in house prices, or buyers’ ability and willingness to ‘gear up’, will affect mortgage credit growth over a long period of time, as the housing stock gradually turns over. For example, in 2006 (the last Census) the total number of house sales was about 100,000, or 6% of the total number of houses in New Zealand at the time. With that rate of turnover it would take 16 years for a house price shift to fully work its way through the system to a higher level of debt. With the lower rate of turnover we’ve seen since the 2008/2009 recession, it would take even longer.
In actual fact, household leverage (the ratio of mortgage debt to the housing stock) has been pretty stable over the past decade (figure 4), meaning that debt levels have been adjusting to changes in house prices faster than housing turnover alone would imply. That suggests that the increase in mortgage debt over the 2000s hasn’t just been the ‘passive’ result of house sales, but there has also been a substantial amount of ‘active’ levering up going on (i.e. topping up the mortgage as prices have risen).9
The model used to generate the forecast in figure 3 abstracts from some of these issues: it simply relates growth in mortgage debt to the level of house sales, and assumes that the level of debt adjusts to a constant ratio to the value of the housing stock, at historically average speeds. It’s therefore best regarded as a snapshot of how the housing market and mortgage growth interacted in the decade before the financial crisis – not of relationships that we’d always expect to hold true.
--------------------------------------------------------------------------------------------------------------------------------
1. These articles are all available from the Westpac website.
2. Specifically, the model is estimated over the period 1999-2007, to focus on data post-dating the financial liberalisation of the 1980s and 1990s. We also attempted to control for a variety of factors that might affect the appetite for debt, such as interest rates, unemployment, and confidence, but of these only interest rates turned out to be statistically relevant (with lower interest rates boosting debt growth).
3. See chapter 4 of the RBNZ’s Financial Stability Report from November 2011 and May 2012.
4. Based on our modelling, it would represent a change in behaviour compared to before the financial crisis, when lower interest rates generally boosted credit growth.
5. See http://canterbury.eqc.govt.nz/news/release/2012/04/eqc-payments-canterbury-top-3-billion and http://www.icnz.org.nz/news/270712.php.
6. Our measure of the housing stock, from Quotable Value, only accounts for houses destroyed by the Canterbury earthquake as they get demolished, and hasn’t been adjusted for other quake-related damage. In recognition of this, we’ve projected forward the housing stock using our forecast for house prices and ‘ex-earthquake’ residential investment.
7. Our forecasts in figure 8 assume that disposable income will grow at the same rate as overall GDP.
8. Note that mortgage debt doesn’t include funding for property developers, which is classified as business debt. But the sale of a new development to a first-home buyer would increase mortgage debt by the total amount borrowed by that buyer.
9. This is supported by evidence from overseas. A survey of Australian households in 2004 found that about 30% of the total housing equity withdrawn that year was of this ‘active’ kind (see Schwartz et al., 2006, http://www.rba.gov.au/publications/rdp/2006/pdf/rdp2006-08.pdf). For the UK, the Bank of England (using banking sector data) comes up with a similar proportion during the UK housing boom, and estimates that it fell sharply - by about two-thirds - after 2007 (Reinold, 2011, http://www.bankofengland.co.uk/statistics/Documents/hew/qb110205.pdf).
--------------------------------------------------------------------------------------------------------------------------------
* Felix Delbrück is a senior economist at Westpac in Wellington. His focus is on forecasting and analysing the New Zealand economy. Before joining Westpac, he worked at the Reserve Bank for seven years. His roles there included maintaining the RBNZ’s main economic model and leading the RBNZ’s international forecasting team. You can contact him here »
48 Comments
... know any good examples of serious deflation in a fiat money system NZHTF?
This is a credit event ie too much debt which has a classic example, the 1930s Great Depression.
and indeed there have been many such events before that even on the Gold standard....so really whether its gold or paper is immaterial.
regards
Actually it is material steven. With a fiat system you can create more and more credit or reserves endlessly. When a central bank uses the word 'unlimited' - what it really means is it will expand the money supply 'without limit if it deems it necessary'. That's just not physically possible under any form of a gold standard - as gold is the reference point (and there are different gold 'standards' of course). A fiat system has no reference point, prices are just digital units in a computer and can keep increasing forever until the currency collapses/is destroyed.
A fiat system allows theft much more easily to take place - I don't need to break into your home to take your savings - I can just devalue them by printing more 'credit money/debt'...it allows me to steal without limit. Every fiat currency ever tried has ended in complete disaster steven, that's not true of gold as gold can repay debt without destroying the financial system in the process, under the fiat 'debt standard' (which is what we have) - all debts can never be repaid because that debt is the money supply.
My parents bought their first house (an average home) in Howick for $14000 sold back in the 90s for 260,000 or so. Average prices will not be returning to those original levels. You can't just use the 30s as comparing apples to apples, the monetary systems are materially very different. You have an overly simplist view of the great depression in the 30s - as Ive already pointed out to you the money supply had to contract back then as they repriced gold far too low after printing money to pay for WW1, thereby forcing the money supply to contract. The only way we will see a deflationary depression is that central banks choose it, by stopping 'printing' or they try and go to a gold standard at anywhere near the current gold prices.... that's not gold causing the depression though...
260,000.00 is 16,494,791.00 yen
14,000.00 is..888,181.00 yen
Mist42nz - I hope your going to share your interest in the Yen with us.
Mist42nz - thought you might be thinking along those lines.
It simply does not matter in effect. What you talk about is printing when not at the zero bound which is where we are at, hence no inflation and if anything dis-inflation is occuring.
Gold standard would cause a depression as all thats left is internal deflation, ppls wages drop.
Central banks wont choose it they are too small compared to a modern economy....and they wont stop it.
regards
<Sigh>
1. We are not at the zero bound. In fact the wall street international banks say that NZers are not in debt enough, we still have hundreds of billions of dollars of equity/wealth for them yet to steal. (Per capita NZ is the second resource rich country in the world, as Owen Glenn recently repointed out).
2. Gold standard would not cause a depression. I don't know ehere you get this idea from? The remonetarisation of gold at much higher rates (the real physical price not the paper price as more paper gold has been sold than what has been mined in western civilisation history and when this scandle breaks it will be one bigger than the libor one). Back in the 30s the US only had one ounce of gold for every 25 ounces of redeemable claims outstanding (yes they really had printed that much). That is because they committed fraud, thats what caused the depression. Banks where falling over - people where losing their life savings - people started pulling their money out and converting it to gold for safety - Roosevelt closed the gold convertibility and defaulted. Setting the gold price at 55,000 an ounce eliminates the US government debt and the european one. It would also eliminate most of the third world debts. There is a reason why those countries keep most of their reserves in gold you know.
3. Too small? REality check steven. The FED is the largest holder of US treasuries. The Fed is also the largest land owner in the US (because of the mortgage backed securities it bought). It leant out 16 trillion at zero interest to lesser corporates like Harley Davidson, McDonalds, varies banks both in the US and offshore....etc.. (btw 16 trillion is more than the entire mortgage debt in the US of A). Too small? Steven there is no finacial institions that are anything like their size (or power). When central banks rule the world - http://www.youtube.com/watch?v=vEJdeWvGIZU
4. Central banks will not stop the depression, no, if thats what you mean. No, they will be the cause of it, and as I said before, its neither inflation or deflation but currency destruction - which will probably make it worse than the 30s depression.
... you mean when central banks print another 20 odd trillion or so? is that what you call deflation? ....mmmmmmm
Well look at core inflation its in a dis-inflation trend, even if 20trillion was printed there is no inflation...not for 4 years........that should tell you the scale needed to give significant inflation...
Sorry but you appear to be trying to have your cake and eat it.
regards
Core inflation as measured by deceptive government manipulations steven? In the last 4 years there is no deflation either, infact real prices continue to creep up (thats inflation).
If 20 trillion isn't enough then make it 50 trillion then. Can they do that? Yes, absolutely - no problemo, whatever is needed to keep the system afloat. Why would the central banks crash the system they control until they have another system that they also control set up? The answer is they will not.
Actually in the last Davos meeting of government and world business leaders some were calling for 100 trillion to be created.
I don't see why you make the comment 'have your cake and eat it'?
When you look at core inflation its declining, ie we have dis-inflation. Sure no deflation overall, look how much/hard the RBs have tried to make sure of that and barely succeeded.
Consider ppls wages....they are generally not rising. So yes sure some things are more expensive but then other things have to drop to match or there is no sale, the wallets are empty net effect is very low inflation around 2% core.
Also with inflation things like Petrol are simply being pushe dup by their marginal cost to extract....or food say by the USA drought....if you want to ignore those, be my huest, I wont in my judegment for what I should be doing financially....which is clear debt, stay liquid in cash and wait.
NB I think the CEO of unilever commented recent;y that he couldnt sell persil at the margin he felt he deserved for his apple like quality washing product (he's delusional if nothing else). I buy a $10bag that lasts me 2 months odd and not a $35persil bag, he's toast.
Or another (US) company who raised prices by 8% and lost 7% sales, they had to drop that rise back. Sure somethings where there isnt a truly competitive market or a state sanctioned monolpoly, yes we see inflation and thats mor elike 4 to 5%.....
"cake and eat it", I think you were arguing both sides of case(s) for the justification of the outcome you see....
Davos, got a link? that would be interesting as that's the sort of sum I envisioned....however I bet the idea is it comes from private investors while the Govns just seed with the odd trillion or so.
aint gonna work IMHO.
regards
Global GPD is about 70 trillion. What do you think adding 100 trillion in debt will achieve?
Just more of the same kiwimm -
- it will kick the can down the road some more (but make the problem worse in the end)
- help to deleverage the banking system (ie save the banks) - (in a fiat system you can decrease leverage by increasing the denominator, the bank reserves, so to speak)
- continue to redistribute real wealth to the top,
- disadvantage those on fixed incomes like salary wage earners and pensioners, beneficiaries...
- artificially lower interest rates and keep them below inflation - robbing savers by stealth
- make the middle class and the their children debt slaves - who will be asked to pay for it
- destroy the real savings of millions of people and push them into poverty
- etc....
same as printing 10 trillion but just to a greater extent... what did you think it would achieve?
Steven I see you are still working on those self limiting beliefs, did you boss tell you this one to make you happy with your zero pay increase for past three years? :-) Have a read of economist comments although you appear to hold onto your ideas soo tighly I expect the same comments next week.
I look at overall costs on all my expenses.....
I dont have such a limited view of just my weekly shopping basket which is seems some such as you do.
I look at the fridge I bought, got a 25% discount ($500) , a TV I got a 20% discount ($500 off). Considering a 29inch hi spec TV was $1200 15 years ago and today a 32inch good spec is $600....Or my broadband bill is now $200 for 150gb.....15 years ago its was $99 for 600meg....
etc
etc
limiting, I look at maths, pyhsics, engineering these are limist I generally understand and work within them, unlike many who dont.
Zero pay increase, considering un-employment is up and I have a well enough paid job, yes Im fairly happy.
I always read economist's views, he thinks and writes why, unlike many such as yourself.
regards
There is no point repeating Economist views on this tread as they sum it well. You appear to have a disconnect between micro and macro issues on this one. I do suggest you reread his posts again...
Just think if you had acted on the right information detailed, got your timing on issues remotely right, instead of holding onto you theory and personal limiting experienes, you could have made enough money in the last three years to buy real assets and set yourself up like PDK.
I'm sure you get a payoff from all of this however however if you had opened your mind and acted you could have provided some more opportunity for your family.
Regards
yeah right.
Good luck with your bet.
I have acted and so far the payoffs been pretty good....
regards
you seem to have a limited view when it comes to things made in the slave labour camps of China and co or the tech sector (which outdates quickly so prices drop) though steven... but with a high dollar - you can negotiate better deals (as retailers margins are higher)... I got a new freeview/bluray/wireless internet/sumsung/etc... unit last month - 50% off... yah!
You have to be acreful that are measuring different things with different criteria. The thing is to look at core inflation where you take the volitile and seasonal things out. So CPI is useless, just take the USA farm drought, grain is up 10% (more?) that is hopefully an annual event....(pray for it as that) its significant but its not inflationary overall if ppl have no more wages to spend, and they dont.
Kids hungry, you just have to look at Greece to see how that is going....and tahst the developed world.
regards
core inflation
Muawhahahahahahahaha
Every time you roll that phrase out I have a giggle.
Gibber - ... 'core inflation'... hahahahaha... excludes house prices, food, energy, interest costs...?....because its not like anyone actually spends their income on such silly, silly things...
A great thing when ppl make a comment like this it shows me they really are not able to see bigger picture.
All they can see is the equiv of their short term shopping basket. You are like Wolly whinning tomatoes were $14 a kilo last winter....guess what, $12 this winter (oh look year peak to peak $2 /kilo less) and in-between $3 a kilo....it tells us nothing of import.
In the meantime you dismiss any Govn data as false there to hoodwink us because your gut feel justs knows its wrong. Instead of understanding that the core inflation metric is there for a specific purpose....as is CPI....one is for long term trends the other is voter pain.
So no you wont trust your lying eyes, ever.
regards
steven, you seem tightly wound up? Relax a little. 'Core inflation' excludes food and energy etc as these things are typically volitile in price, its useful in setting interest rate policy which has long time leads, but that's where its use ends - its not 'real' world inflation, its not used for anything else. Headline inflation is what people really pay.
Show me someone who actually pays core inflation increases? Funny enough I think you are missing the bigger picture. I'm not dismissing Govn data as false - it measures what it measures (even the govn would admit that core inflation is not what people pay). And as for CPI if I eat steak every night and it goes up in price and I switch to cheaper dog food instead - the CPI will show deflation and I now have more spending power as dog food was cheaper than the original cost of the steak. CPI stopped being a measure of the cost of living increases years ago.... (although many still think thats what it is).
and to me it shows your ignorance.
regards
ouch.... but ahhhh right back at you big boy...
:-)
Oh NZHTF, if what you mean is deflation in real terms then okay, I agree totally incomes are in real terms declining (while in nominal terms still rising), that's because they are not keeping up with rising prices. I see no real reason why this trend will not continue, housing, rents, rates, insurance, energy, food, school fees, all rising in price, and average incomes, while nominally increasing, will not keep up and the middle class will shrink. Yes. There is and will be more poor people. Yes. However if deflation was really occurring or going to occur, the poor will be much better off of course, as they are on fixed incomes (benefits) so relatively their purchasing power will increase and they can buy shoes and lunches etc...
Most people spend most of their income on essentials (not luxuries) so overall that's inflation on a weighted basis.
2013 may well see a correction in property (or not - probably not if interest rates drop further), as these things happen from time to time, not necessarily a bad thing though (unless you are overleveraged - which the great majority are not).
Yes, clueless, "Most people spend most of their income on essentials (not luxuries) so overall that's inflation on a weighted basis."
If you have no more money you cant spend any more even on essentials, unless you have access to credit.
regards
again ouch... the reason they have no more money is that the essentials cost more (ie because of inflation) - nominal wages are going up (thats a published Govn stat) the Nat govn has even increased the minimum wages twice (or was it 3 times? - not sure, Im not on it), even put up working for families and other benefits (5% was it?), still its not enough to cover the increase for many in essentials...
Correct....fear...
regards
Sorry NZHTF not true. Central banks are fighting for price stability (actually inflation between 1-3% in NZ case). Governments always fight for inflation (as its the hidden tax) as they want to spend more and more and more over time requiring more and more bonds to be issued (which is the value behind fiat currency). In fact only in government budgeting is a decrease in the rate of increased spending called a 'cut'.
"Also limiting government discretion is desirable. The historical record shows only too clearly that, when politicians and central bankers are in charge of the integrity of fiat money, they have never been able to resist the temptation to manipulate the fiat money to their own benefit. They have always driven its value to the cost of production - which is near zero."
Or as former Fed Chairman Paul Volcker "It is a sobering fact that the prominence of central banks in this century has coincided with a general tendency towards inflation, not less. By and large, if the overriding objective is price stability, we did better with the 19th century gold standard and passive central banks, with currencu boards, or even with 'free banking'".
NZ Heads to Financial Slavery - have you considered shortening your name? Because this site only shows 'NZ Heads to Fin' which conjures up some shark-like activity. You need to get it into 15 chars.
E.g. NZ Debt Slaves
or
FinanceSlaveNZ
...... silly me , I thought it stood for " NZ Heads to Financial Success " ........
So , he's not an enthusiastic John Key supporter after all ?
Ha ha JK? No, although possibly a Jack Kerouac fan with that stream of consciousness prose ... or a poet?
& love the stumbling over Caps Lock & Bold keys ...
"Even if (as we expect) mortgage rates eventually rise back to around 8%, this would still imply debt servicing costs well below their 2007 peak"
OK, so the bank economists "expect" mortgage rates to go back to 8%. This of course would depend on a full USA recovery (not going to happen), China full steam ahead (reverse happening), UK & Eurozone recovering (never happening before WWIII & EU World Govt), so keep waiting for the 8% rates back again.... Do these people read newspapers? Or use any modellling outside their 2004 dated spreadsheets?
More rapid debt deleveraging might happen if banks actually started to act in their customers interests - such as 'sweeping' multiple accounts, credit cards & home loans and propose the best efficient debt restructuring / repayment scheme for those in moderate to deep debt.
The middle class incomes are disappearing with e-commerce & globalisation / outsourcing growing - more middle class incomes are shifting to minimum wage , slave franchising etc .... while a fewer upper middle class are increasing incomes - leaving little room for debt repayment overall.
exactly.
Have spoken to a few people here in Adelaide with investment properties who are really worried. I reassured them that Aus is a couple of years behind NZ in the cycle - before too long the RBA will start chopping interest rates again, which will prevent a property plunge as per NZ
They breathed deep sighs of relief
MB - suggest you read about the long term impacts of QE before you suggest that the performance of economies, and how much they can handle higher rates, actually counts for anything as to where rates will eventually head - you need to understand fiat currencies.
And if you believe that QE is a temporary state, try to figure out what other avenues politicians have aailable to them to keep the system afloat (hint, none). In the long term you'd be right, but you'd never get to survive even to the medium term without some serious reading.
GA - so you see 8% mort rates on the horizon? When QE eventually stops?
You represent the Pillars of 4 by infiltrating social media sites?
'Bank economist' or yet another.....................Bank spin doctor?
Justice - Zoro has now got a goofy sidekick that he has indoctrinated well.
these idiots just don't get it do they?
Economist
Please stop embarrassing ( in the eyes of others, certainly not themselves) so many of the posters on this thread by actually pointing out facts, and monetary history and realities, which make them look like light weights - I wouldn't mind so much if they actually listened and tried to check their facts and learn something, in fact at times I assume they must be doing so until I read similar crap from them on other posts
Fact, no more money generated inflation (pull inflation) for 4 years....if anything dis-inflation.
Economist has an opinion on how things are that matches yours, by all means buy lots of gold...
Me, I'll avoid more debt and stay in cash...
Make your choice as an adult and stop deriding others who make choices as they see the facts.
We'll get to see whos right pretty shortly I think it will be only one of us that is clear.
regards
Fair enough steven.. everyone is entilted to their opinion of course. Just realise that if you have your cash in the bank, the bank has you more leveraged (like 90%) than any property investor I know - and you are an unsecured creditor with only a paper claim.... the only real difference between a bank and finance company is ah...ah... ah.... well.... one starts with a 'b' and one starts with a 'f'.
and speaking of this the RBNZ put out its policy/procedure to handle bank failures recently... havent had a chance to read it yet... think I might though... if your a deflationist I would suggest you read it - esp if you have signicant funds in banks... and if you believe now is like the 30s (ie there will be major bank runs and failures) I mean...
Avoiding excessive debt and overleverage I think is a great idea... no one knows when central banks will pull the plug, I think it will not be soon though... there is so much more wealth for the intl banking cartel to steal via printing and they worked so hard for so many decades to remove all currencies from any gold banking (last to go was the Swiss franc?)
'Fact, no more money generated inflation (pull inflation) for 4 years'
Yes steven, central banks are winning 'so far' they are more or less mantaining price stability overall (with a 'normal' inflation bias - in NZ case 1-3%). The question is are they going to keep winning? If they stop printing we will have a deflationary depression as the credit system collapses - and by that I dont mean the mortgage debt does get paid I mean the multi multi trillion derivative bubble implodes. Most of these derivatives (mainly interest rate swaps) exist because the system is broken requiring more and more 'printing' in ever greater numbers. My opinion until I see evidence otherwise, is that they will print themselves into hyperinflation, as they are trapped.... but I don't see a sudden collapse just around the corner like you do... I think financial crisis will come like waves - each one getting bigger and bigger and requiring larger and larger 'interventions', we may have several years yet... and one of the reason I believe that is that for them to take complete control they need to bring in gun confiscation in the US... and they are not even close... I mean they have planned this thing for many many years - they will not risk collapsing the system too early... they are incrementalists by nature... at the moment they have their hands full just trying to save the euro - their pet project.... but the thing is - with the internet more and more people are waking up to what is really going on.... mmmm
Almost always after hyperinflation comes deflation (Gresham's Law) as real money returns. Fortunately gold goes up in both inflation and deflation though so at the end of the day Im hedging my bets. In terms of real money (gold) we are seeing serious deflation, in terms of fiat we are still seeing mild inflation, so in a way we both might be right, depending on your reference point.
Increased household debt magnify the boom and bust cycles. Sometimes I wonder if banks ever factor that into their thinking and risk analysis.
Indeed it does...
The only factor is the annual bonus and how big its going to be.
regards
Hi Felix, good sound analysis and comment; you’ve covered household debt and ability of today’s kiwis to sustain/support that level/growth ~ in relation to property/shelter. It would be interesting to factor in your comment/effect on coming generation’s ability to afford housing (around $500K)? Bearing in mind skilled higher paid employment generally carries student debt; starts on low wages until ability proven. I don’t believe inheritance cover the debt as retiring home owners (who in 1980 paid around $30K) tend to sell to cover the cost of retirement home etc. Cheers.
We welcome your comments below. If you are not already registered, please register to comment
Remember we welcome robust, respectful and insightful debate. We don't welcome abusive or defamatory comments and will de-register those repeatedly making such comments. Our current comment policy is here.