

Today's Top 10 is a guest post from Kirdan Lees, principal economist at the New Zealand Institute of Economic Research.
As always, we welcome your additions in the comments below or via email to david.chaston@interest.co.nz. And if you're interested in contributing the occasional Top 10 yourself, contact gareth.vaughan@interest.co.nz.
See all previous Top 10s here.

1. Atlanta Fed absolutely nails how to forecast GDP
Quant work generally gets a bad rap in economics but the reality is numbers are the only game in town. A great example over the last US GDP growth with the Atlanta Fed’s latest whizzy tool, GDPNow! absolutely killing the latest read with an estimate of 0.1% annual quarter-on-quarter growth. This was super close to the Bureau of Economic Activity’s 0.2% growth and well south of market expectations of 1.0%. Just imagine what could be done in real-time by syncing up the method to say Xero or BDO’s big client database.
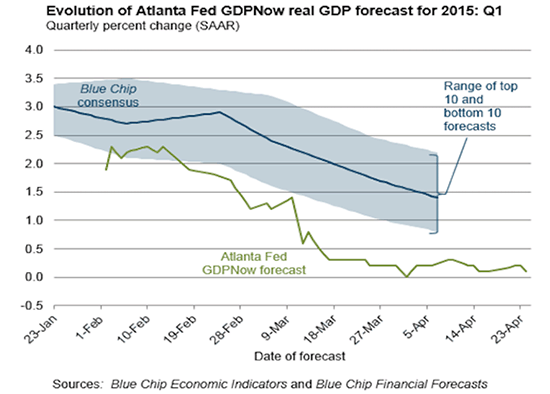
The economy grew just 0.2% to start 2015, well below the 1% growth that Wall Street economists were expecting.The Atlanta Fed saw first quarter GDP rising just 0.1% — right at what the BEA’s official number was. (On April 22, the Atlanta Fed saw GDP growth at 0.2%, but this number was revised slightly lower after last Friday’s durable goods report.)
2. Can we improve the framework for discussing trade agreements?
This post from Stephen Grenville, a well-respected ex-Deputy Governor of the RBA, who is regularly dragged to New Zealand to comment on our policy debates caught my eye. He picks up on the contrast between the move towards transparency in monetary policy versus the cloak of secrecy on around trade negotiations. Sure the actual negotiations need to be kept secret, but Stephen points out much more could be done to have a more transparent model that engages the public.
In Australia, hardly a week goes by without a senior RBA official discoursing on some aspect of monetary policy. The US Federal Reserve is exerting itself mightily to make sure that everyone understands how it is thinking about the unwinding of quantitative easing. The Bank of England has experimented with 'forward guidance': telling the public its current thinking about its future actions. This flood of information is now regarded as 'best practice' for central bankers everywhere.
How curious, then, that nothing substantive can be said publicly about the TPP until the negotiation is over, when the only choice for the Australian parliament will be to accept or reject the treaty.

3. US bureaucracy gets GitHub – any lessons for New Zealand?
Five thirty-eight regularly thrashes out what you can and can’t take from data, so it was interesting so see them post on US officials' adoption of one of the tools of the trade, GitHub from the tech sector. Turns out GitHub can handle more than just modelling and numerology – it’s being used to improve transparency on who said what on the development of government regulation.
“The normal process is to draft it in Word, circulate the document as an attachment and then solicit comments,” says Ben Balter, whose title at GitHub is government evangelist. “It takes months.” For technology regulations, this notice-and-comment process seems particularly outdated. The advantage of using GitHub to solicit comments is that it allows for inline editing and public tracking of revisions, showing who proposed which changes and who in the government accepted them. Balter and other GitHub enthusiasts say this will usher in more transparency to the opaque world of government rule-making.

4. Growing up in America: where to do it.
Raj Chetty and co-authors have just released stage 2 of the equality of opportunity project that identifies which US commuting zones (cities) determine future incomes taking a range of other contributing factors into account. Seattle turns out to be the best city or commuting zone. Fayetteville, North Carolina – not so much.

How can we improve economic opportunities for low-income children? The Equality of Opportunity Project uses “big data” to develop new answers to this question. The previous phase of the project presented statistics on how upward mobility varies across areas of the U.S. and over time. In the current phase, we focus on families who moved across areas to study how neighborhoods affect upward mobility. We find that every year of exposure to a better environment improves a child’s chances of success, both in a national quasi-experimental study of five million families and in a re-analysis of the Moving to Opportunity Experiment. We use the new methodology and data to present estimates of the causal effect of each county in America on upward mobility.
5. Klippa - Swedish for cut.
With some market commentators calling for a OCR cut in New Zealand, it's well worth taking a look around the globe where many central banks are looking to cut rates just as the US looks poised to take things in the opposite direction. The Riksbank looks set to take rates even lower (the current rate is minus 0.25% with prices falling at the minute.

A flickering revival in the Swedish inflation rate fizzled out in April, data showed Tuesday, piling pressure on the central bank to cut interest rates to new record lows.
The Swedish statistics agency said the consumer price index, which measures the cost of a range of household goods and services, fell 0.2% compared with April last year. That was below the 0.1% rise forecast of analysts polled by The Wall Street Journal.
6. Art vs science – battle of the ‘burbs?
Richard Florida at citylabs has an interesting post that looks at recent work to identify what creative neighbourhoods look like and what science neighbourhoods look like. The answer: creative types love the inner city while science grads hang out in the burbs.
Innovation and creativity are the basic engines of economic development in cities, regions and nations. But what makes some places more innovative than others? How do certain neighborhoods come to specialize in different types of creativity?
Basically, the science-based firms and industries are out in the suburbs, along highway interchanges, and in newer, low density suburban campuses. The creative industry locations are much more urban, dense, closer to the core of the city, walkable, mixed-use and often served by public transit.

7. Latin America faces a hangover from the GFC.
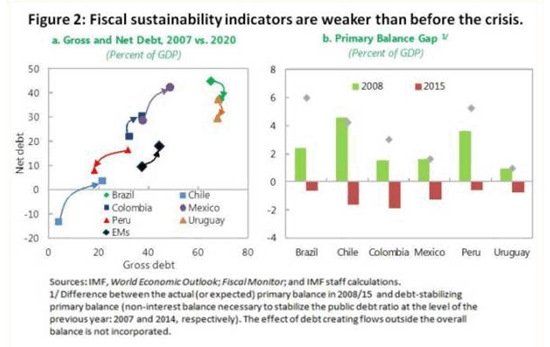
Much has been made of Air New Zealand’s new direct route from Auckland to Buenos Aires. More than anything, that route is dependent on airline economics and connectivity from South America to Asia and vice versa. Nevertheless according to this blog from the IMF, Latin American economies that were hit hard by the GFC are in for a rough period.
Latin America is heading for tougher times. Regional growth is expected to dip below 1 percent in 2015, partly as a result of the drop in global commodity prices. How well placed is the region for the coming lean times?
Countries face this slowdown from much weaker fiscal positions than when the global financial crisis hit. Then, Latin America responded strongly with expansionary fiscal policies, including explicit fiscal stimulus programs in many countries. But, as growth has recovered, this increase in spending has proved difficult to reverse.
8. Let’s hear it for the (US) millennials.
Pretty much impossible to turn the newspaper these days without bumping into talk of the baby boomers and ageing New Zealand. That makes it easy to miss the large bump in our population aged 21-24 that for a narrowly defined age cohort trump most other age bands running around. Turns out their counterparts in the US, the millennials, are also storming back and now make up a larger fraction of the labour force than the baby boomers.
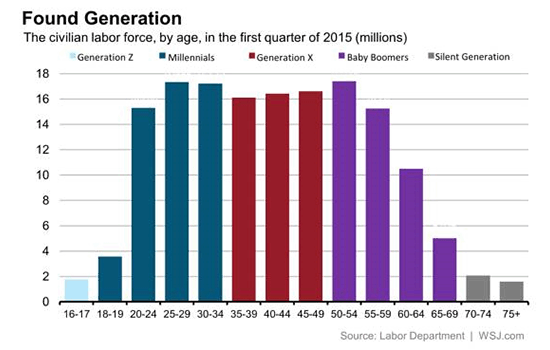
Millennials, generally described as 18-to-34-year-olds, have moved past Generation X to become the largest generation in the American workforce, according to a Pew Research Center analysis. Using Census Bureau data, Pew found there are 53.5 million millennials in the workforce, or about one-third of all workers, as of the first quarter of the year. By comparison, there are 52.7 million Gen Xers, 44.6 million baby boomers and 3.7 million from the Silent Generation.
“With its disproportionately large share of immigrants, and at an age of transition from college to the working world, the millennial generation’s workforce is highly likely to grow even further in the near future,” Richard Fry, a senior researcher at Pew Research Center, said in a blog post.
9. It isn’t 1987 again or even 2007.
My ex-colleague from Reserve Bank days, Michael Reddell, has been laying out some of his thinking for public consumption on his new blog Croaking Cassandra. The pace and regularity of posts is rapid and there is no shortage of material – 25 years plus of senior postings at the Reserve Bank, Treasury and the IMF have accumulated a vast number of ideas. Well worth a look and the post from Monday on the low risks to financial stability from Auckland’s housing market caught my attention.
“A repeat of 1987 is just not remotely in prospect at present. If bank balance sheets start growing rapidly it might be time for some more concern, but at present issues around Auckland housing should be seen for what they are – the outcome of policy blunders in which restricted supply runs into rapid population growth – rather than any sort of material threat to financial or macroeconomic stability.”
Michael also points out that the ratio of credit to GDP has been arrested with the credit growth at levels far, far, lower than before the GFC.
10. What about that stunning UK election result?
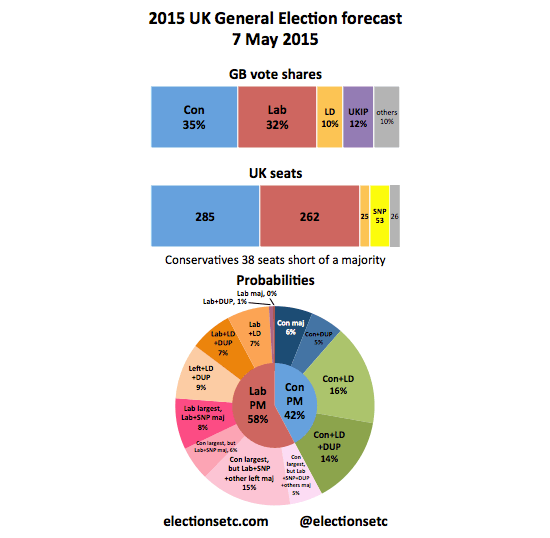
Stephen Fisher at Elections etc didn’t do quite as bad as some at predicting the UK election but interesting to see his analysis of why the numbers didn't work out so well for the UK as Nate Silver did for the US election, for example. He suggests the Conservative majority came almost entirely at the expense of the Lib Dems with newly minted incumbent MPs from the last election enjoying a long honeymoon period avoiding losing out to Labour MPs in England and Wales.
The election outcome was a shocking defeat for Labour and a remarkable victory for the Tories, both relative to expectations from the opinion polls and considering that you have to go back to Salisbury in 1900 to find an instance of a Prime Minister increasing their share of the vote after being in power for more than 18 months. Overall Labour will be just a point up on the abysmal 30% of the GB vote that Gordon Brown achieved in 2010. Moreover Labour are down from 258 seats to 232 (-26).

Cartoon courtesy of Nicholson cartoons http://nicholsoncartoons.com.au/

We welcome your comments below. If you are not already registered, please register to comment
Remember we welcome robust, respectful and insightful debate. We don't welcome abusive or defamatory comments and will de-register those repeatedly making such comments. Our current comment policy is here.