
By Mieke Welvaert*

The tides are turning in the residential construction sector, with activity in Canterbury coming off its peak but activity in Auckland gaining momentum.
As changes occur in where we build, we are also beginning to see changes in what we build.
The purpose of this article is to paint a picture of the changing composition of new dwelling consents in Canterbury and Auckland, and what it means for these cityscapes and building activity nationally.
In New Zealand, dwelling consents over the year to July were 8.4% higher than in the July 2014 year. Within this increase was a minimal 0.6% lift in houses, while consents for townhouses (54%) and apartments (21%) were up substantially from last year.
Key drivers of the change in the composition of new dwelling types (particularly the higher proportion of denser dwelling types, apartments and townhouses) have been the peak in Canterbury’s residential rebuild and Auckland’s bid to address residential space and housing constraints.
One of the biggest drivers of change in the composition of dwellings over recent years has been the Christchurch rebuild. Nearly 10% of the 2010 housing stock across Waimakariri, Christchurch, and Selwyn was lost in the 2011 earthquakes and aftershocks. The subsequent rebuilding work saw dwelling consents in Canterbury climb 40% above their historic average, with this extra activity in Canterbury making up 10% of nationwide consents over the mid-2011 to mid-2015 period.
What the rebuild meant for the composition of dwelling consents was that a larger proportion of new dwellings nationally were houses. In the years following the earthquake we saw that people from the Christchurch area rebuilt on existing land, or moved to areas to the north and west of the city, such as Rolleston and Rangiora, where space was less of a constraint.
As a result, houses got up to 89% of new dwelling consents in Canterbury, compared to the pre-earthquake ratio of 82% in 2010. Activity in Canterbury pushed the nationwide number of houses, as a proportion of total new dwellings, three percentage points higher than it would otherwise have been.
Graph 1
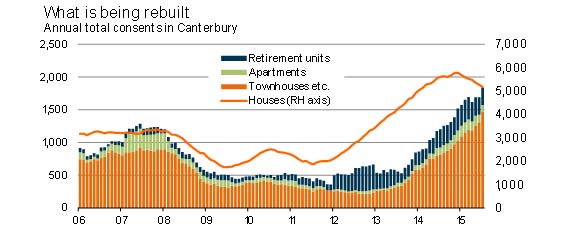
Now that dwelling consents in Canterbury have passed their peak, the compositional effects of the Christchurch rebuild on national building activity are beginning to reverse. Part of the reason for this reversal is that Canterbury is playing a shrinking role in nationwide consent activity, but the composition of new dwelling consents in Canterbury is also changing. Graph 1 illustrates that while consents for houses in Canterbury have tailed off, consents for townhouses and apartments are still climbing. As the resources from residential work shift to the reconstruction of non-residential buildings in the Christchurch city centre, consents for denser dwelling types, closer to the city centre, have also risen.
Since the start of 2015, Canterbury has added an extra 388 townhouses and apartments to annual national consent totals, while 619 houses have dropped out. As the townhouse and apartment figure is also rebuild driven, this too will reach its peak within the coming year. Consequently, national consent activity will have less of a weighting towards both Canterbury and consents for houses over the year ahead.
Talking about the elephant in the room
Auckland accounts for 38% of the national housing market and the rapid growth in house prices in the region have been a hot topic for quite some time.
One of the interesting things about the Auckland housing market is that section prices rose from 27% of the average house price in 1984 to 55% by 2006.
With median house prices now 62% higher than four years ago (which coincides with Auckland’s trough in building consents), the premium on space is encouraging the rapidly growing Auckland population to build more densely.
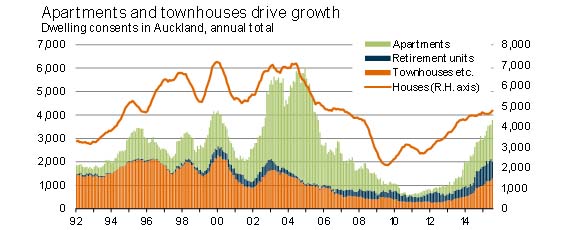
Graph 2 illustrates this shift, with Auckland house consents plateauing at around 4,700 approvals per annum in July. In contrast, consents for townhouses and apartments continue to climb, reaching their highest combined annual level on record in July.
Graph 2
What is most curious about building consent growth is the pattern of building activity across different parts of Auckland. Although all parts of Auckland are experiencing an increase in consent activity, some areas are experiencing faster rates of building densification than others.
To get an idea of which Auckland wards are building upwards at the moment, Figure 1 illustrates the townhouses and apartments as a proportion of new dwelling consents (excluding retirement units) in each Auckland region. Around 90% of consents in the Waitemata and Gulf ward are townhouses and apartments, down to just 4% in Rodney, with the more central parts being most densely built upon.
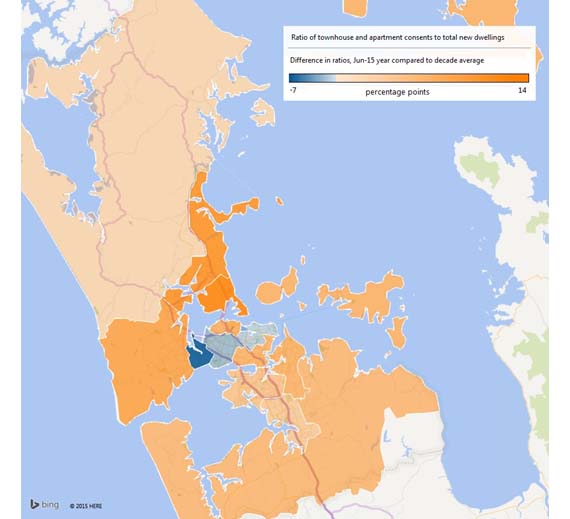
Figure 2 illustrates something a bit more interesting: the scale on the map shows the difference between the proportion of townhouses and apartments built in a ward, compared to the average proportion for that ward over the past decade.
A darker orange colour indicates where a greater proportion of townhouses and apartments are being built relative to that ward’s history, while a darker blue colour illustrates a smaller proportion of townhouses and apartments are being built in the area than usual. Areas being more densely built upon are in the central city and the outer ring of wards in Auckland. In contrast, the wards neighbouring Waitemata are where densification is occurring less rapidly than previously.
Although Auckland is being built upward, this densification is not in proportion to one’s proximity to the centre of town.
Figure 1
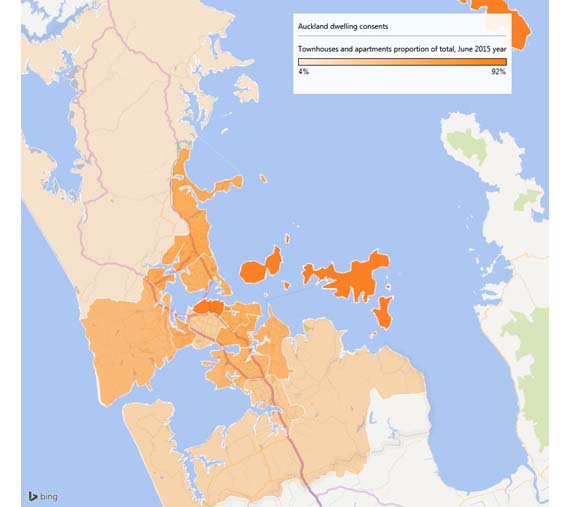
Figure 2
What does this mean for these city-scapes?
Although Auckland and Canterbury are essentially developing in two different directions (one spreading outward and the other rebuilding a centre), they are both likely to end up with a similar city construct: where there are hubs of economic activity within the metropolitan area which residential areas can be built around, rather than living and working patterns being entirely focused on the CBD. Admittedly, Christchurch is only likely to develop in this way because the earthquakes forced people to create new business and residential hubs, whereas this kind of development in Auckland is going to be an engineered process via the Auckland Unitary Plan.
Contrary to what you might expect, these changes mean that densification of both cities is likely to continue, because there is an attraction to build up in more areas, rather than just the CBD.
As this unfolds, we expect nationwide numbers of apartments and townhouses to climb further over time.
Mieke Welvaert is an economist at Infometrics. You can contact her here » This article originally appeared in Infometrics’ newsletter and as part of an in-depth client article. The article has been republished here with permission.
3 Comments
Mieke this is a quality article. Good read. Thanks
This is why I keep returning to this site, for the really good articles like this.
Indeed, Preferences trump Plans. Christchurch's Old CBD is gonna be bereft of residents (20,000 was the Planners' Target, but this is a coupla decades away) because, simply put, business has moved out and away for the foreseeable future. And ECON101 reinforces that: Riccarton has office space to burn, untenanted, at around $300/square/year, but new builds in the Old CBD will rent at $500+. Needless to say, Gubmint, health and banks, plus the attached remora (lawyers, accountants, consultants and other reef fish) look to be the main tenants: OPM tends not to observe classical economics....
We welcome your comments below. If you are not already registered, please register to comment
Remember we welcome robust, respectful and insightful debate. We don't welcome abusive or defamatory comments and will de-register those repeatedly making such comments. Our current comment policy is here.