Analysis by the World Gold Council.
Gold continued its ascent in April, breaking the US$3,500/oz mark in intra-day trading during the month.1 While gold pulled back from its record highs, it still finished strong, above US$3,300/oz and rising by 6% m/m (Table 1). Gold’s return was more modest in developed market currencies and even fell slightly in Swiss francs on the back of local currency strength versus the dollar.
In fact, our Gold Return Attribution Model (GRAM) points to the significant plunge in the US dollar – captured by ‘opportunity cost (FX)’ – as one of the key drivers of gold’s performance in April (Chart 1). Other contributing factors were a spike in market volatility and geopolitical concerns (‘risk and uncertainty’). The model also suggests that there was a degree of mean reversion that created a drag on gold’s performance, as some investors likely took profits following four consecutive months of strong returns (‘momentum’).
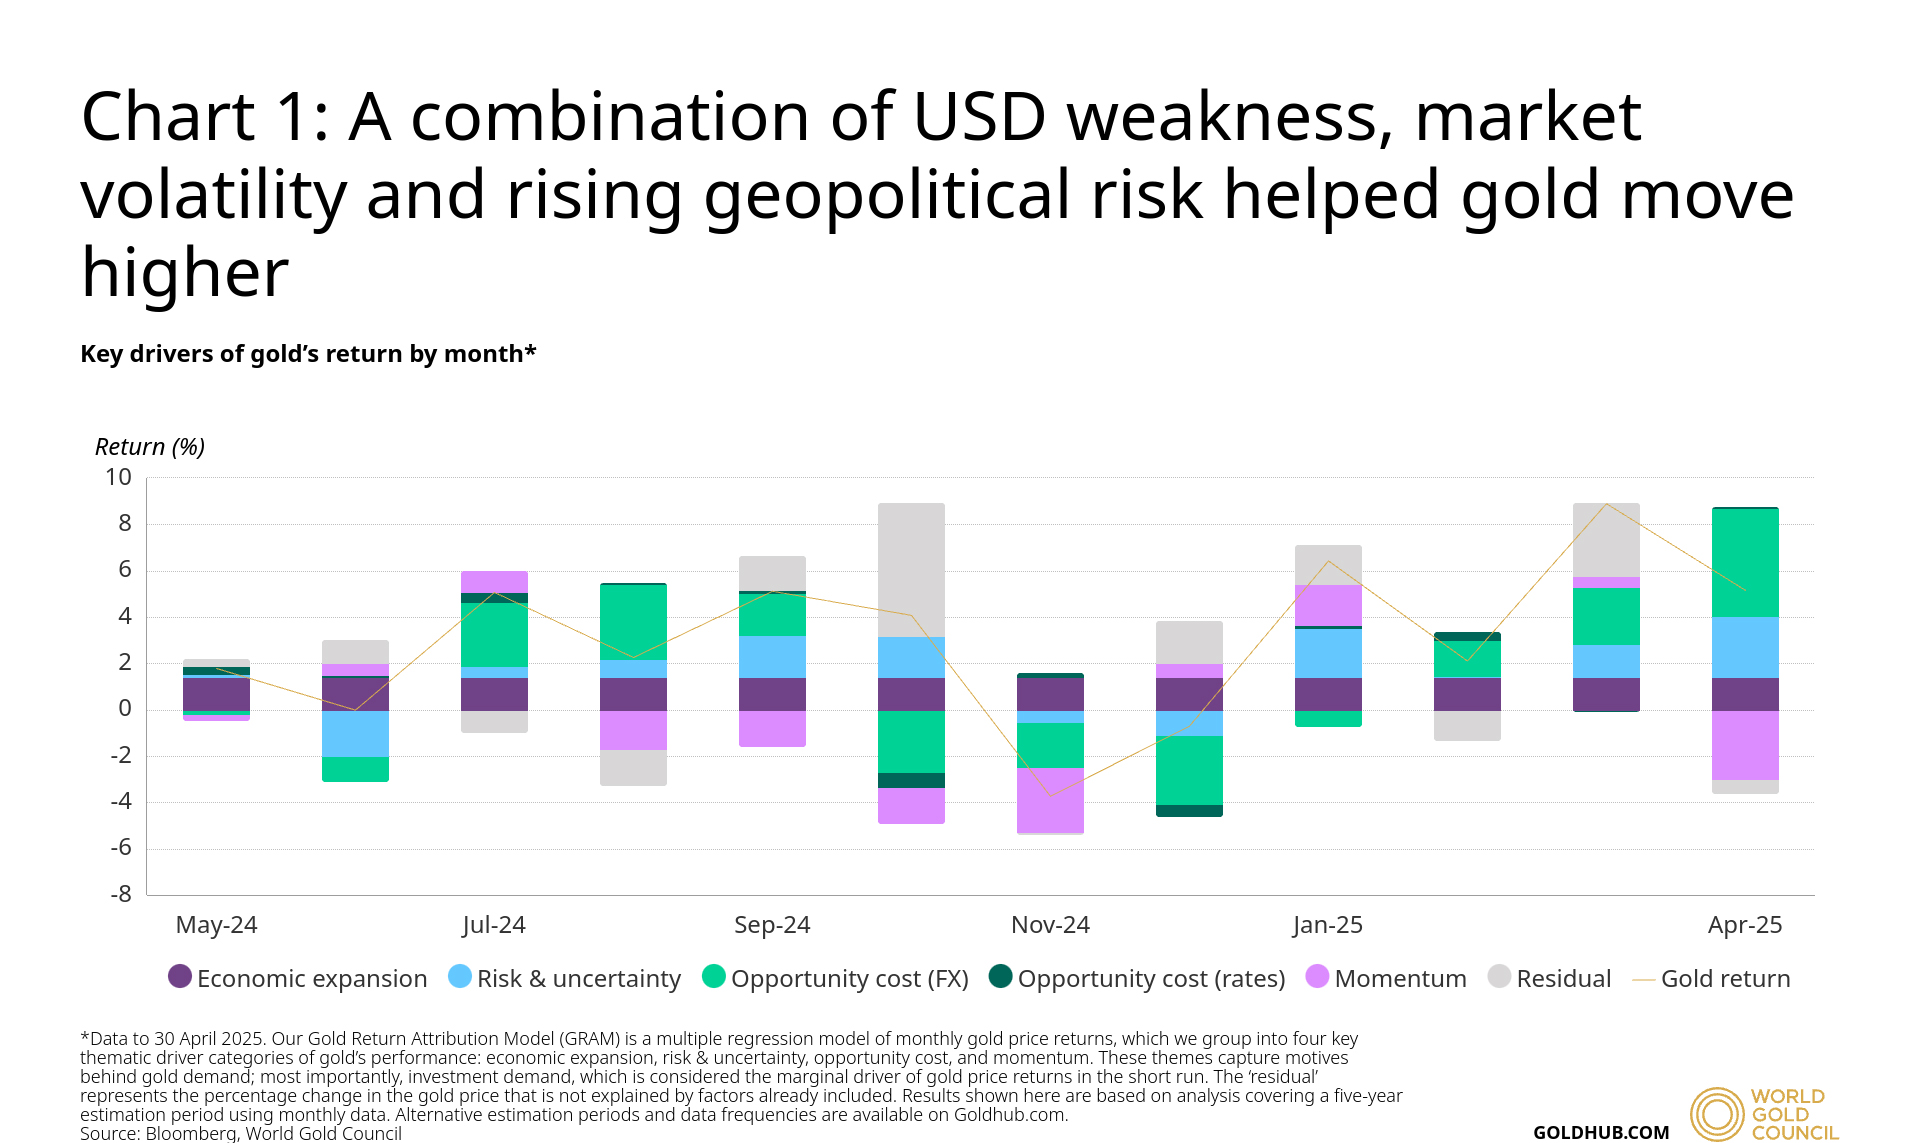
*Data to 30 April 2025. Our Gold Return Attribution Model (GRAM) is a multiple regression model of monthly gold price returns, which we group into four key thematic driver categories of gold’s performance: economic expansion, risk & uncertainty, opportunity cost, and momentum. These themes capture motives behind gold demand; most importantly, investment demand, which is considered the marginal driver of gold price returns in the short run. The ‘residual’ represents the percentage change in the gold price that is not explained by factors already included. Results shown here are based on analysis covering a five-year estimation period using monthly data. Alternative estimation periods and data frequencies are available on Goldhub.com.
Table 1: Gold continued its upward run in almost all currencies amidst USD weakness vs. developed market currencies
Gold price and performance in key currencies*
| |
USD
(oz) |
EUR
(oz) |
JPY
(g) |
CAD
(oz) |
INR
(10g) |
RMB
(g) |
AUD
(oz) |
| April price* |
3,302 |
2,915 |
15,189 |
4,556 |
93,928 |
779 |
5,158 |
| April return* |
6.0% |
1.2% |
1.1% |
1.7% |
5.9% |
6.9% |
3.4% |
| Y-t-d return* |
26.6% |
15.7% |
15.2% |
21.4% |
23.7% |
26.4% |
22.3% |
| Record high price* |
3,434 |
3,006 |
15,628 |
4,743 |
98,228 |
830 |
5,393 |
| Record high date* |
22-Apr
2025 |
22-Apr
2025 |
22-Apr
2025 |
22-Apr
2025 |
22-Apr
2025 |
22-Apr
2025 |
22-Apr
2025 |
Source: Bloomberg, World Gold Council
*As of 30 April 2025. Based on the LBMA Gold Price PM in USD, expressed in local currencies, except for India and China where the MCX Gold Price PM and Shanghai Gold Benchmark PM are used, respectively.
Can gold’s run last?
Gold is up by nearly 27% y-t-d, significantly outperforming major asset classes.2 Not surprisingly, investors are asking what’s behind the move and how sustainable it might be.
Gold has been supported by a combination of:
- US trade policy uncertainty and, more generally, geoeconomic risk
- A weakening US dollar
- Higher inflation expectations combined with lower bond yield
- Continued central bank demand.
Against this backdrop, investment flows via gold ETFs have significantly ramped up. In Q1, gold ETFs amassed US$21bn of inflows – the strongest quarter in three years – with an additional US$11bn in April. Collectively, US funds have led the way, but Chinese funds have increased their holdings by a whopping 77% y-t-d.
Early innings?
Does this mean that the gold investment market is becoming saturated? We don’t believe that’s the case.
Previous gold bull runs have coincided with significant inflows in gold ETFs. But there seems to be room to grow. For example, gold holdings by funds listed in Western markets are 575t (or 15%) below their record high.3 In addition, Asian gold ETFs, driven by Chinese and Indian investors, have been consistently growing for the past two years, signalling a structural shift in adoption.
Furthermore, COMEX futures net longs, which typically represent the more speculative end of the investment spectrum, do not look overextended. They are currently sitting near 570t – their lowest level in more than a year and well below their 2020 high of over 1,200t.
This, of course, would not rule out further profit taking by some market participants and potential pullbacks in price.
Risk by any other name…is still risk
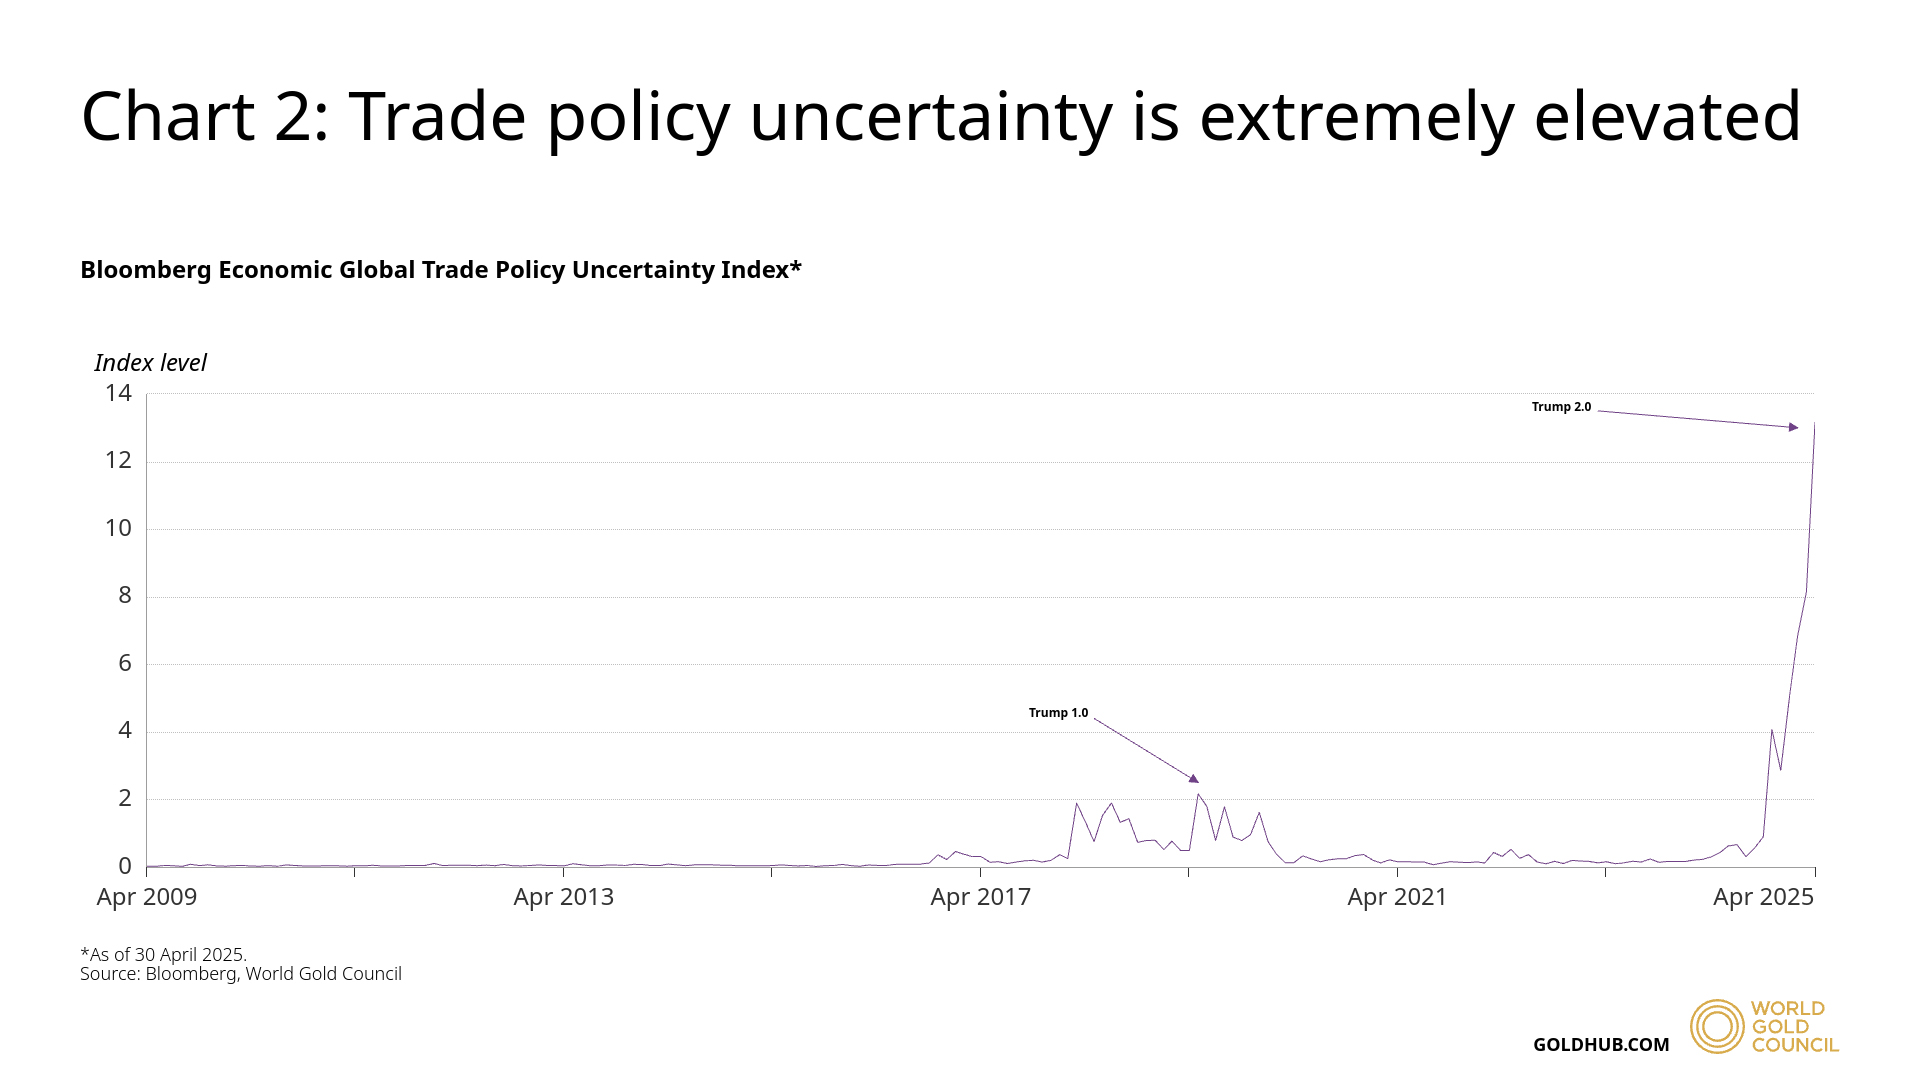
Investors have grown increasingly concerned over the growth and inflation outlook from the fallout of the ongoing trade war, both in the US and globally (Chart 2). The rise in uncertainty around trade policy and international relations has been supportive of gold as investors typically turn towards safe-haven assets for downside protection in those types of environments.
This has been exacerbated by pressure on US Treasuries and the dollar, which traditionally function as safe havens. This phenomenon is well documented by the media.4 In addition, conversations with wealth managers suggest that, for the first time in a long time, many investors have been seeking to hedge their overexposure to US dollar assets.
We estimate that trade concerns have accounted for approximately 10% to 15% of gold’s return y-t-d, stemming from USD devaluation, heightened geopolitical and market risk, and at least partly from some of the investment flows we’ve seen in recent weeks.5
However, even if trade negotiations were to progress and conditions to improve, we would not expect gold to completely reverse its risk-induced bump.
For one, gold remains well bid despite some easing of trade tensions and the noteworthy rebound in the US stock market since early April. In addition, investors – especially international ones – appear wary of policies on which the Trump administration may concentrate next…and all other policies that may come over the following three and a half years.
Focusing on the ‘real’ side of real rates
A major concern regarding US trade policies is the potential effect they could have on US and global inflation. Indeed, short-term inflation is expected to rise in the US according to consumers and market measures (Chart 3).
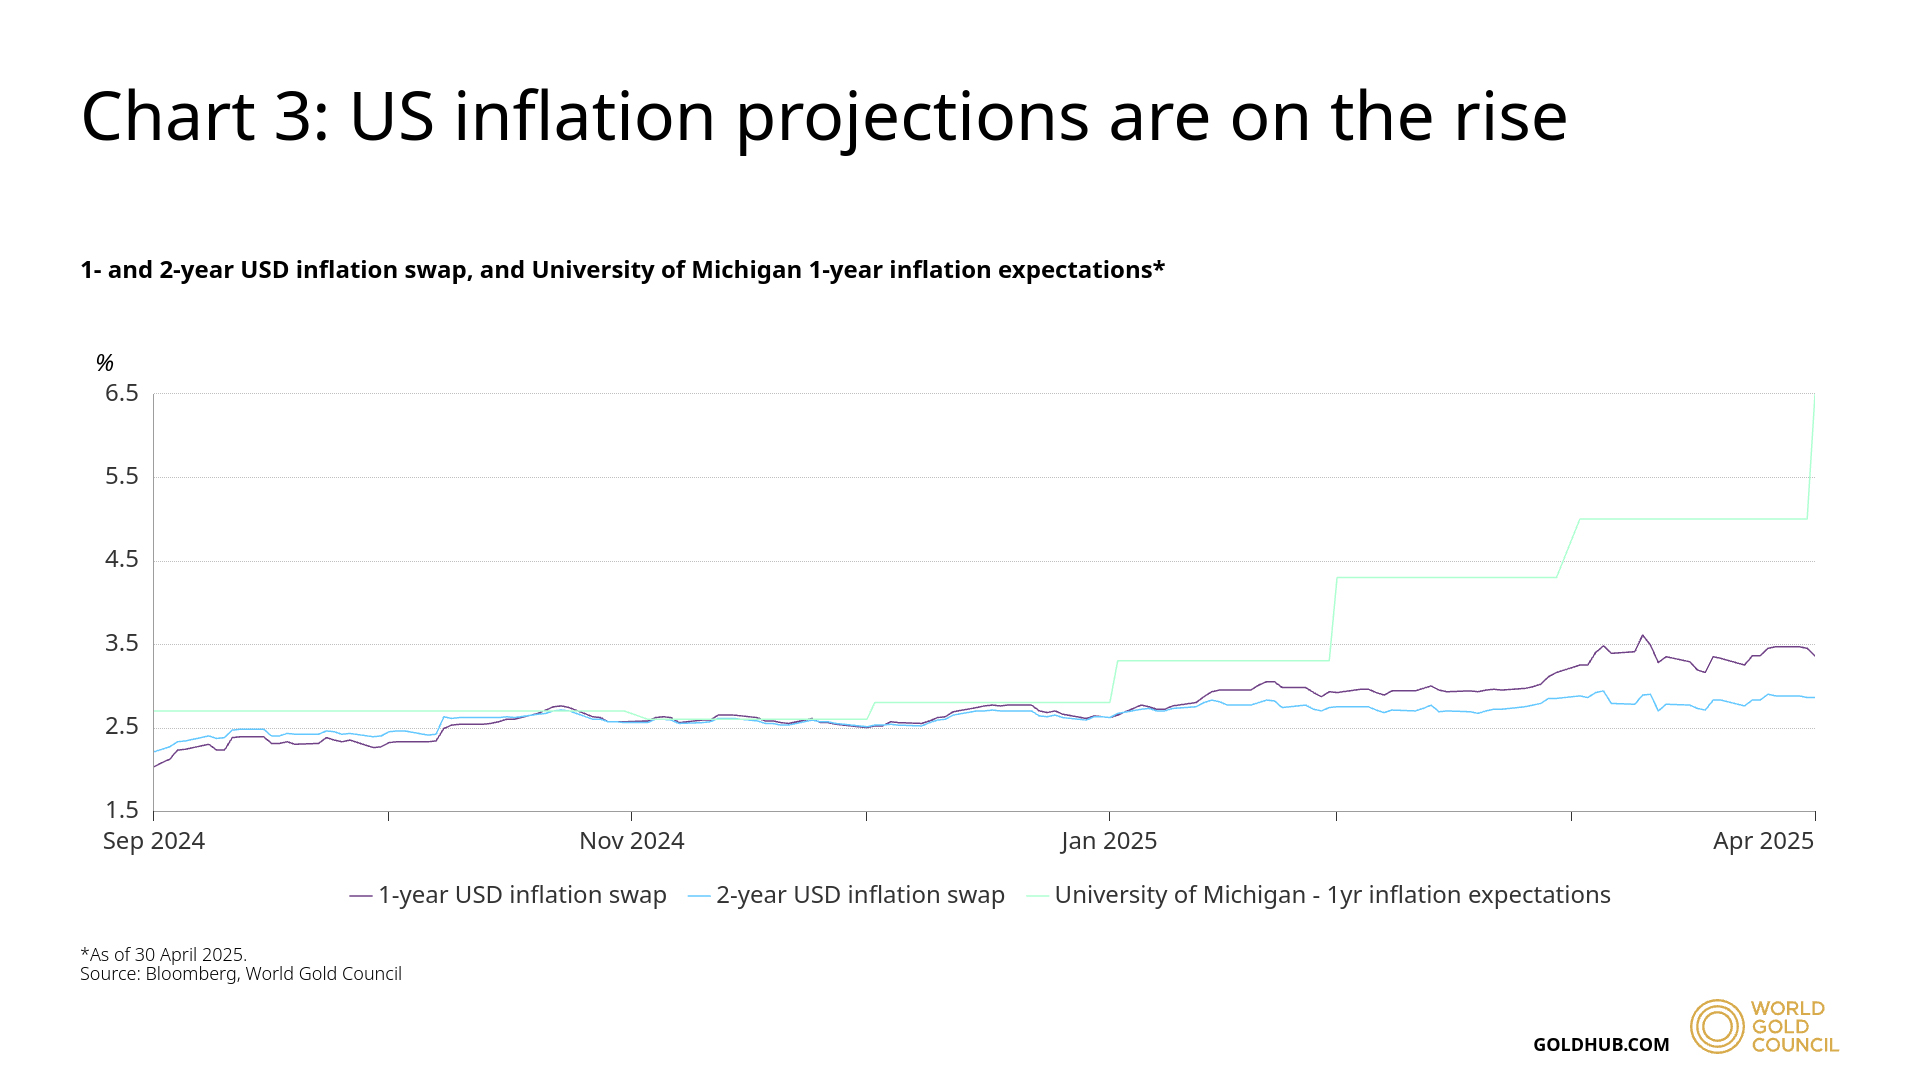
Generally, high inflation is supportive for gold as investors seek out real assets for protection amidst falling purchasing power. Inflation, however, is often accompanied by higher rates that may create a drag on performance.
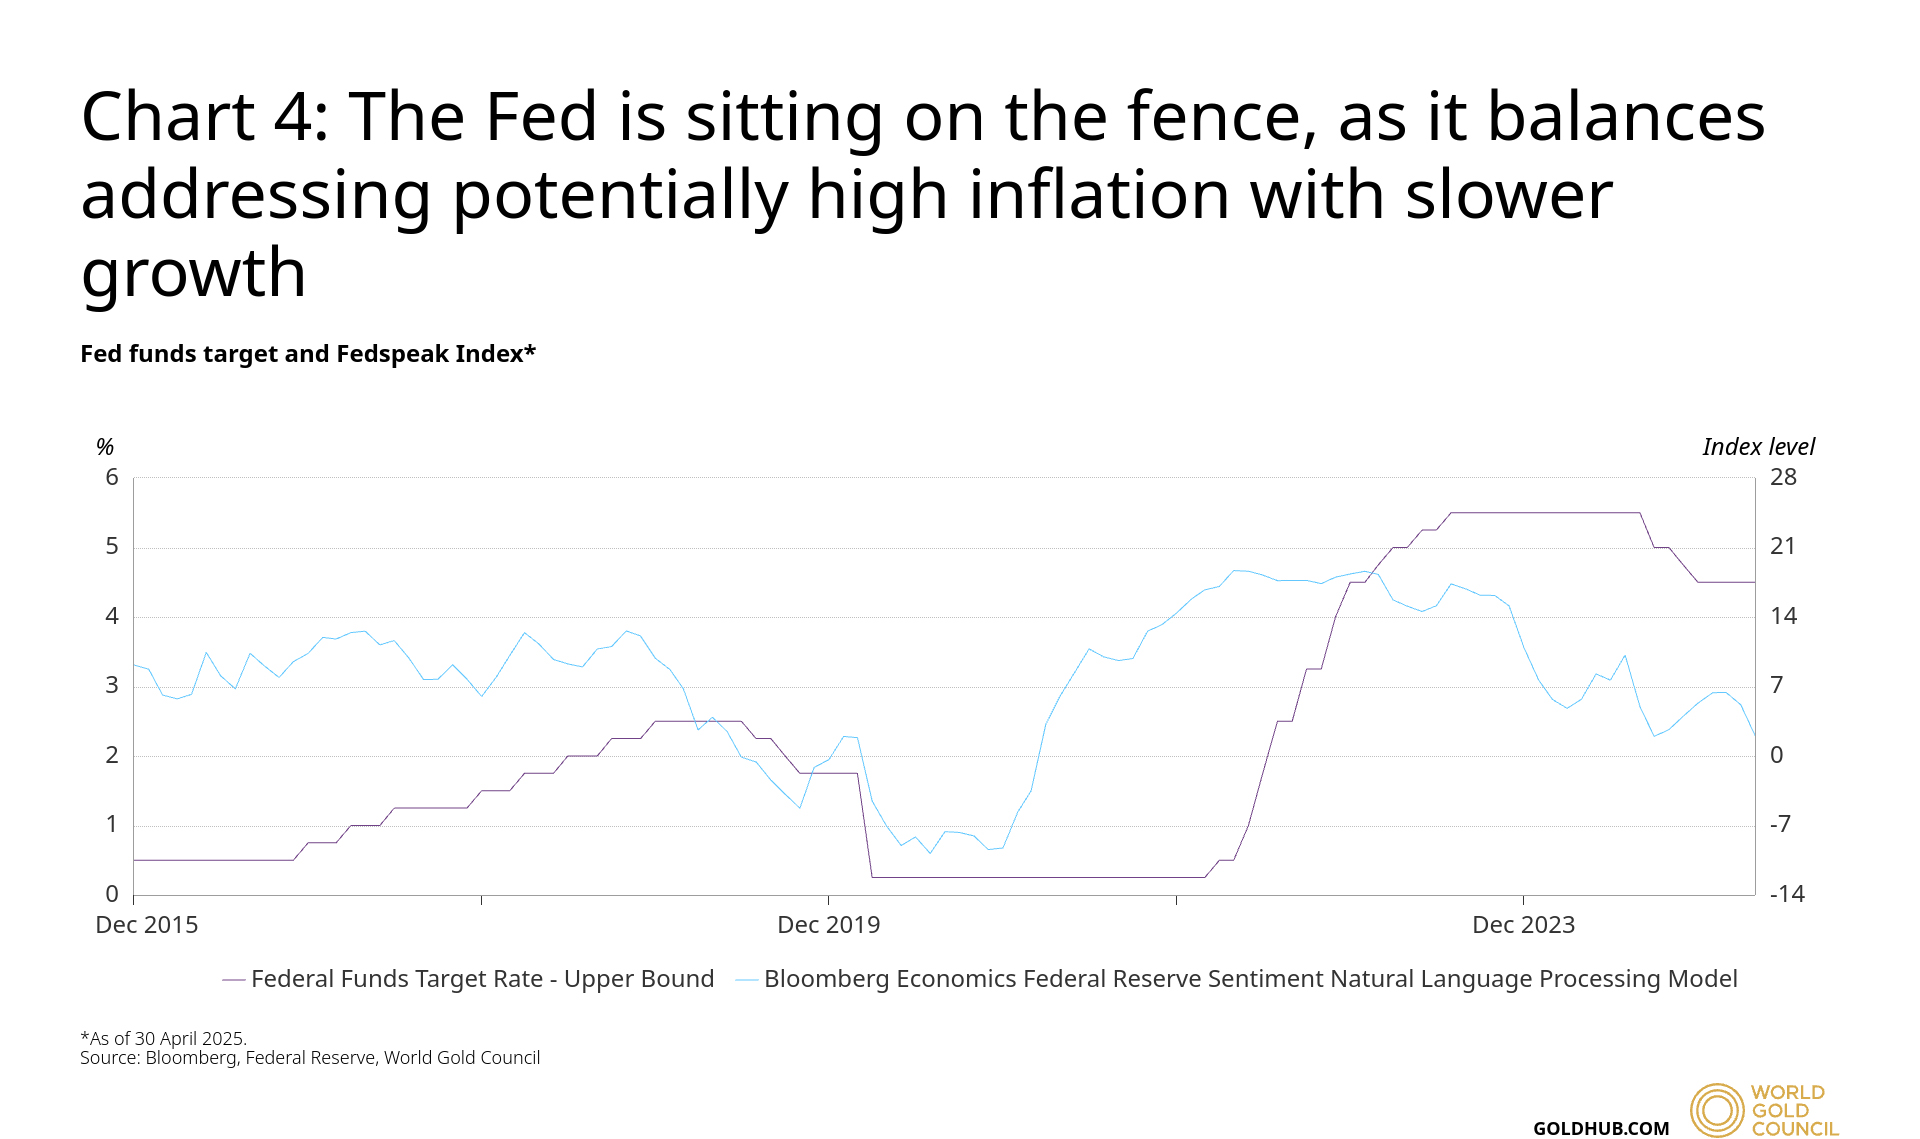
In this instance, there may be a limit to how much interest rates may rise:
The Fed has become a little more dovish recently. According to the Fedspeak Index, the FOMC is now very much on the fence as it balances the need to control inflation with supporting slowing growth (Chart 4).
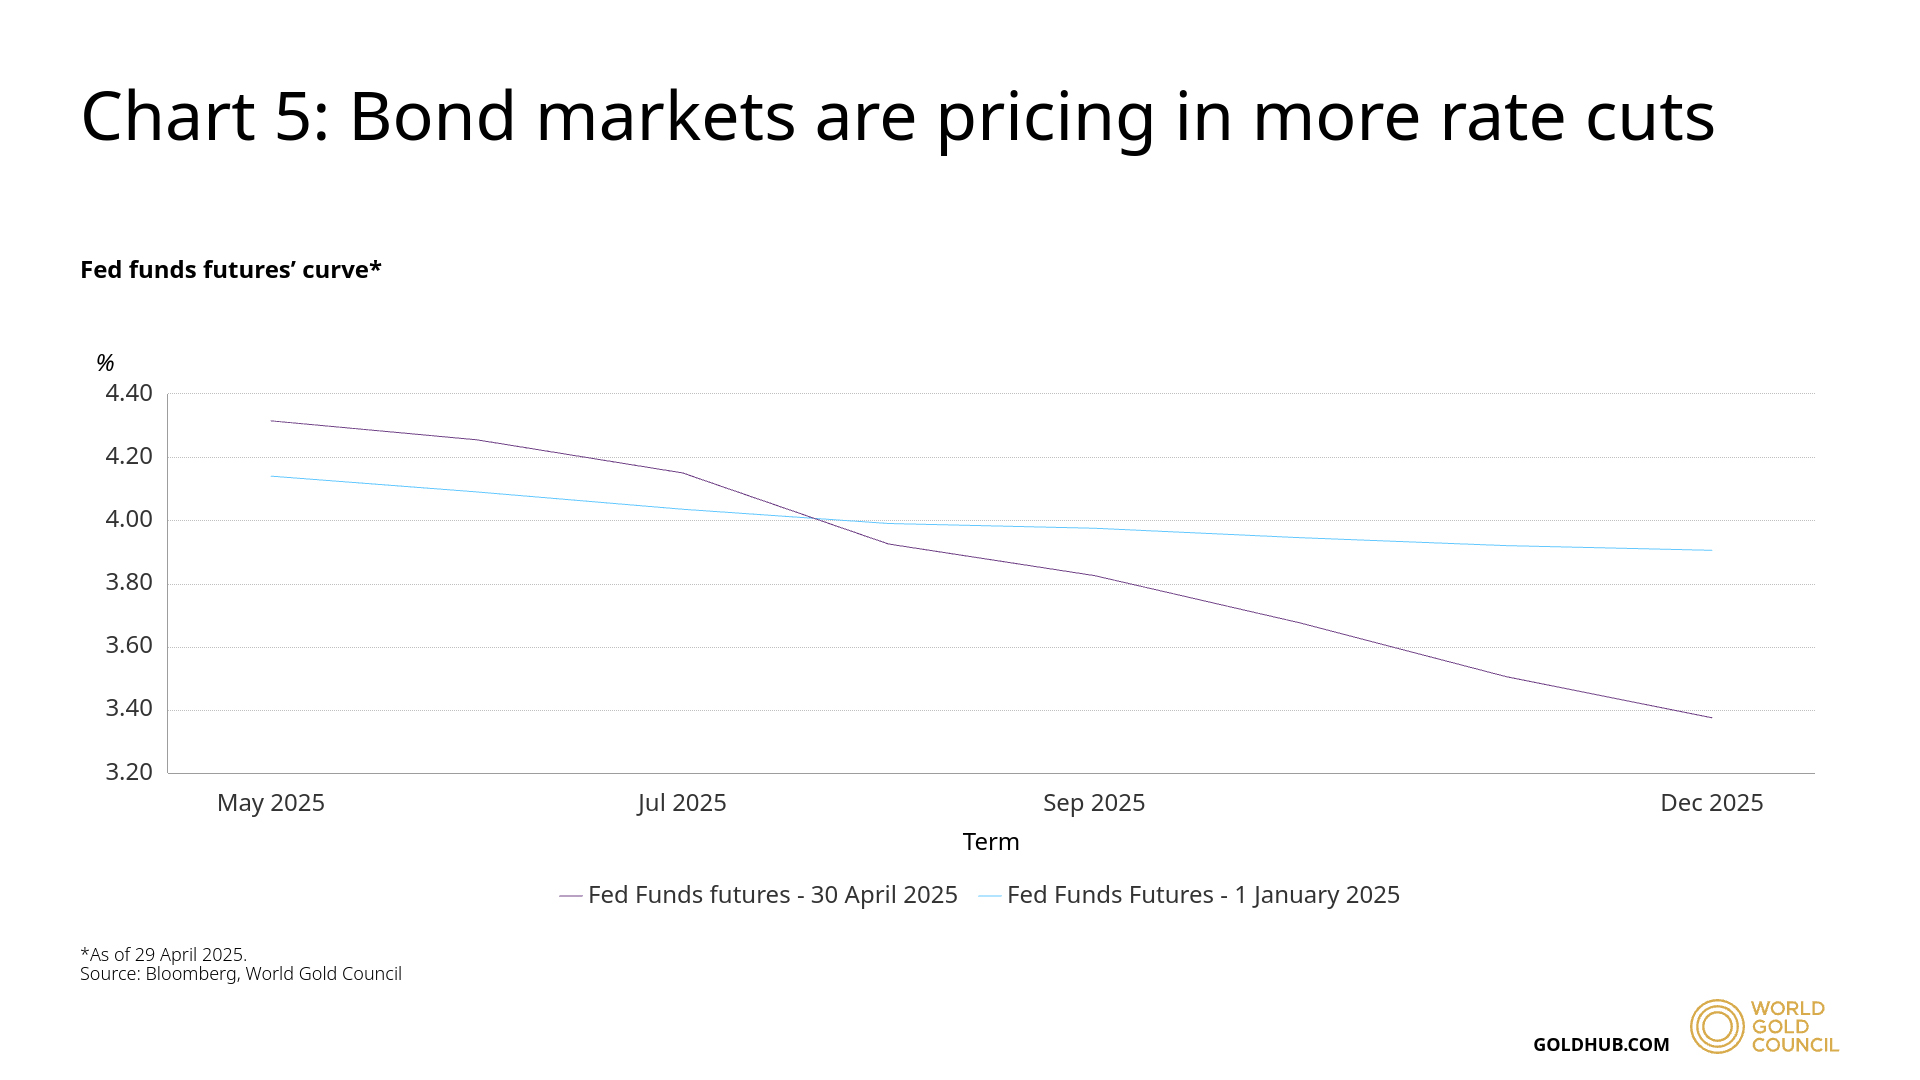
At the same time, bond market participants certainly think that the Fed will prioritise economic health in this stagflationary-led dilemma (Chart 5).
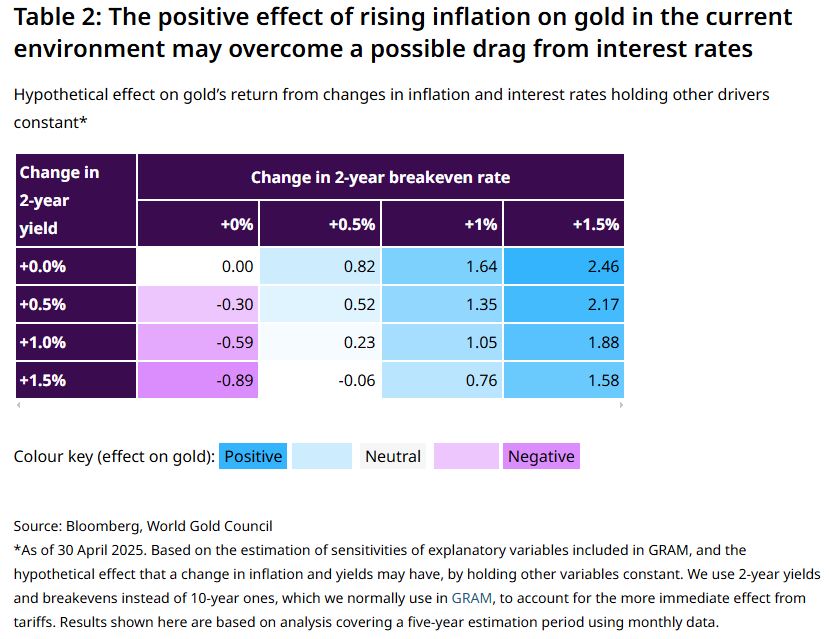
Even if the Fed were to turn more hawkish, which we believe would only occur in the event of longer-lasting inflation effects, gold could remain supported.
Using GRAM, we have analysed the effect that changes in inflation and yields can have on gold, holding other variables constant. The main conclusion is that, in this environment, a rise in inflation will likely have a more positive effect on gold’s performance than the potential drag that higher rates may bring (Table 2).
We have covered multiple reasons why gold investment may remain strong. However, it is important to consider potential headwinds.
While investment flows are the key driver of large gold price movements, consumers are an important contributor to gold’s performance in the medium and long term. And they are key to sustaining gold trends. Higher gold prices have been deterring some jewellery buyers and while consumers can adjust to higher price levels, they still need time to adapt.
At present, recycling has remained surprisingly muted, but deteriorating economic conditions could change this, bringing additional supply and adding pressure to gold.
Central banks have also been an important source of demand for the past three years, significantly contributing to gold’s performance. We still expect central bank demand to remain robust this year, but rapidly rising prices have, in the past, temporarily decelerated purchases.
In sum…
Gold’s performance so far this year has been remarkable. But the speed at which it has occurred has raised concerns about its endurance.
We believe that structural reasons will enable investment demand to continue to thrive:
- Uncertainty surrounding US policies and their effect on the dollar
- More sensitivity to higher inflation expectations and a higher likelihood of lower interest rates
- Lower gold accumulation levels than in previous cycles.
That, of course, would not prevent potential pullbacks driven by profit taking or signs of advancements in trade negotiations.
Equally, for gold’s bull run to be sustainable for longer, consumers need to be given time to adapt to higher prices.
Footnotes
Based on gold’s spot price (XAU) as of 22 April 2025.
Based on the LBMA Gold Price PM as of 30 April 2025.
Collective gold holdings across all listed gold ETFs in North America and Europe reached a record high of 3,746t on 6 November 2020; their holdings as of 30 April 2025 are 3,170t.
US Treasuries sell off as trade war calls haven status into question, Morningstar, 9 April 2025.
As of 30 April 2025. Estimated by adding contributions from the US dollar, GPR, market volatility and gold ETF flows from GRAM over the past two months.
This article is a re-post from here.
 Our free weekly precious metals email brings you weekly news of interest to precious metals investors, plus a comprehensive list of gold and silver buy and sell prices.
To subscribe to our weekly precious metals email, enter your email address here.
Comparative pricing
You can find our independent comparative pricing for bullion and coins in both US dollars and New Zealand dollars which are updated on a daily basis here »

We welcome your comments below. If you are not already registered, please register to comment
Remember we welcome robust, respectful and insightful debate. We don't welcome abusive or defamatory comments and will de-register those repeatedly making such comments. Our current comment policy is here.