
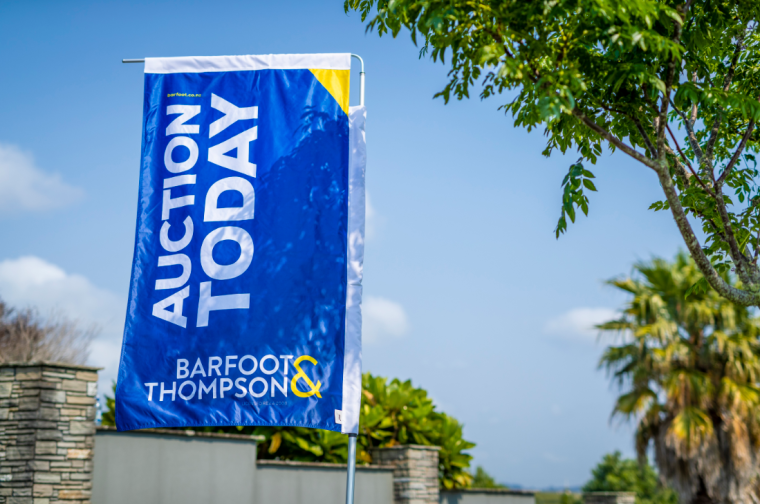
The number of homes being auctioned by Auckland's largest real estate agency continues to grow strongly, although the sales ratio dropped back sharply last week.
Barfoot & Thompson auctioned 85 residential properties last week (1-7 June), which was an 89% increase on the 45 properties the agency auctioned in the last week of May.
The Orders of Sale published by the agency for this week show the number of properties being auctioned is continuing to rise, suggesting the market is well on the way to returning to normal trading patterns following the progressive removal of lockdown restrictions.
However while the number of properties auctioned by the agency showed substantial growth last week, the number of sales achieved at auction was more tepid.
Last week Barfoots recorded 35 sales at auction, giving an overall sales rate of 41%, while the sales rate at the individual auctions ranged from zero at the Shortland Street auction on June 4, to 50% at the North Shore auction on June 4 (see the table below for the full breakdown)
That compares with 29 sales overall at the previous week's auctions, which was a 64% sales rate.
Sales rates have been very strong in auction rooms throughout the country since they reopened after lockdown, possibly due to a build up of unsatisfied buyer demand and the limited choice available as the market slowly came back to life.
The drop in the sales rate last week may be a sign that the pent up demand could be starting to be satisfied, and the increase in choice that more properties coming onto the market is giving vendors may be starting to make them a bit more picky.
However it's probably too early to draw any firm conclusions on those trends and it will likely be the end of the month before a clearer picture emerges of where the market is sitting.
Details of the individual properties offered and the results achieved are available on our Residential Auction Results page.
The comment stream on this story is now closed.
| Barfoot & Thompson Residential Auction Results | |||||||
| 1-7 June 2020 | |||||||
| Date | Venue | Sold | Sold Prior | Sold Post | Not Sold | Total | % Sold |
| 2-6 June | On-site | 5 | 7 | 12 | 42% | ||
| 2 June | Manukau | 9 | 15 | 24 | 38% | ||
| 2 June | Shortland St | 3 | 3 | 6 | 50% | ||
| 3 June | Shortland St | 7 | 1 | 9 | 17 | 47% | |
| 3 June | Pukekohe | 1 | 2 | 3 | 33% | ||
| 4 June | North Shore | 7 | 1 | 8 | 16 | 50% | |
| 4 June | Shortland St | 3 | 3 | 0 | |||
| 5 June | Shortland St | 1 | 3 | 4 | 25% | ||
| Total | All venues | 33 | 1 | 1 | 50 | 85 | 41% |
We welcome your comments below. If you are not already registered, please register to comment
Remember we welcome robust, respectful and insightful debate. We don't welcome abusive or defamatory comments and will de-register those repeatedly making such comments. Our current comment policy is here.