
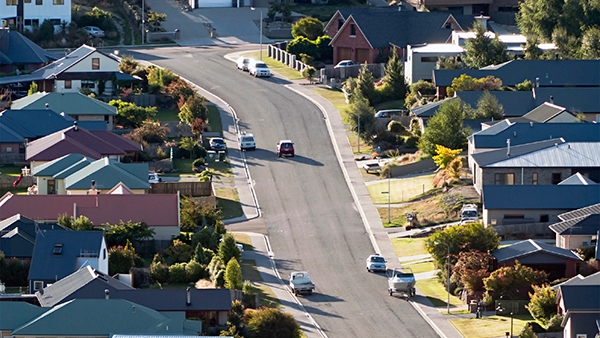
The average value of New Zealand residential dwellings increased by 18.4% over the last 12 months, reaching $871,375 in April, according to the CoreLogic House Price Index.
Auckland remains the most expensive housing region in the country with an average value of $1,247,980. That's up 15.6% compared to a year ago.
Only four of the main urban districts within the Auckland region now have average values below $1 million and they are all in South Auckland - Manukau Central $865,833, Manukau North West $944,101, Papakura $857,037 and Franklin $807,295.
Central Auckland's eastern district, which includes coastal suburbs such as Kohimarama and St Heliers, remains the most expensive residential district in the country with an average value of $1,840,372.
That's followed by Coastal North Shore at $1,619,902, and Manukau's eastern suburbs, which include suburbs such as Howick and Mellons Bay, at $1,421,295.
There are only three NZ districts that have average dwelling values below $300,000 - Buller $247,675, Grey District $271,649 and Waitomo $296,725.
Only five districts posted single digit growth in average values over the 12 months to April - Hauraki in the upper North Island at 6.4%, with the others all in the lower South Island - Queenstown-Lakes 6.3%, Southland 9.5%, Central Otago 9.5% and MacKenzie 4.2%.
At the other end of the scale the highest annual value growth occurred in the rural North Island districts of Tararua 43.6%, Rangitikei 42.7% and Ruapehu 38.8%.
CoreLogic said there was some evidence of a slowing in the market in April, with requests for valuations down 11% compared to the previous six months.
"Looking ahead, our expectation for future gains has been tempered, as the profitability of investment property has reduced due to the tax changes around interest deductibility," CoreLogic head of research Nick Goodall said.
"This will likely mean a slowing of the recent growth rate over the next few months, which will give the Reserve Bank some time to assess whether they need to announce any intention to limit interest-only loans or put a cap on high debt-to-income lending."
The table below shows CoreLogic's average dwelling values for all districts and their percentage changes over the last three and 12 months.
The comment stream on this story is now closed.
| CoreLogic House Price Index | |||
| Three Months to April 2021 | |||
| District | Average current* value $ | 3 month change % | 12 month change% |
| Far North | 560,696 | 4.1% | 15.0% |
| Whangarei | 708,601 | 11.6% | 23.3% |
| Kaipara | 697,128 | 6.9% | 19.9% |
| Auckland - Rodney | 1,142,991 | 8.1% | 16.2% |
| Rodney - Hibiscus Coast | 1,110,715 | 8.8% | 15.7% |
| Rodney - North | 1,173,420 | 7.5% | 16.5% |
| Auckland - North Shore | 1,420,050 | 6.4% | 13.6% |
| North Shore - Coastal | 1,619,902 | 6.1% | 13.4% |
| North Shore - North Harbour | 1,339,751 | 5.4% | 10.8% |
| North Shore - Onewa | 1,177,733 | 7.6% | 16.5% |
| Auckland - Waitakere | 1,003,580 | 8.2% | 18.6% |
| Auckland - City | 1,466,063 | 7.2% | 14.6% |
| Auckland City - Central | 1,243,298 | 6.1% | 10.7% |
| Auckland City - Islands | 1,363,829 | 9.0% | 18.2% |
| Auckland City - South | 1,336,871 | 7.5% | 17.2% |
| Auckland_City - East | 1,840,372 | 7.4% | 14.3% |
| Auckland - Manukau | 1,099,785 | 7.0% | 18.3% |
| Manukau - Central | 865,833 | 9.0% | 20.4% |
| Manukau - East | 1,421,295 | 7.2% | 19.7% |
| Manukau - North West | 944,101 | 6.2% | 16.2% |
| Auckland - Papakura | 857,037 | 8.7% | 18.3% |
| Auckland - Franklin | 807,295 | 7.1% | 16.3% |
| Thames Coromandel | 980,717 | 8.4% | 19.7% |
| Hauraki | 499,603 | 2.3% | 6.4% |
| Waikato | 619,882 | 8.8% | 18.4% |
| Matamata Piako | 562,663 | 0.9% | 11.2% |
| Hamilton | 759,110 | 9.4% | 20.5% |
| Hamilton - Central & North West | 699,990 | 8.8% | 18.9% |
| Hamilton - North East | 932,159 | 10.0% | 20.3% |
| Hamilton - South East | 689,823 | 6.6% | 18.6% |
| Hamilton - South West | 696,916 | 10.9% | 23.4% |
| Waipa | 748,903 | 7.5% | 15.6% |
| South Waikato | 385,414 | 9.2% | 25.6% |
| Waitomo | 296,725 | 15.9% | 20.0% |
| Taupo | 695,979 | 9.9% | 23.5% |
| Western BOP | 827,301 | 6.1% | 16.6% |
| Tauranga | 921,581 | 3.7% | 19.0% |
| Rotorua | 638,169 | 6.2% | 26.8% |
| Whakatane | 657,560 | 17.6% | 27.5% |
| Kawerau | 374,653 | 15.0% | 28.7% |
| Opotiki | 438,963 | 17.8% | 17.0% |
| Gisborne | 579,361 | 10.0% | 33.3% |
| Wairoa | 350,029 | 32.5% | 36.4% |
| Hastings | 747,743 | 12.7% | 27.1% |
| Napier | 793,098 | 15.9% | 30.1% |
| Central Hawkes Bay | 505,962 | 10.8% | 25.7% |
| New Plymouth | 616,312 | 8.1% | 20.8% |
| Stratford | 423,464 | 13.0% | 28.1% |
| South Taranaki | 371,987 | 15.7% | 30.2% |
| Ruapehu | 346,877 | 12.0% | 38.8% |
| Whanganui | 484,812 | 13.8% | 31.8% |
| Rangitikei | 407,521 | 12.0% | 42.7% |
| Manawatu | 568,994 | 7.3% | 22.7% |
| Palmerston North | 659,430 | 9.9% | 30.0% |
| Tararua | 392,174 | 16.7% | 43.6% |
| Horowhenua | 560,933 | 14.1% | 27.1% |
| Kapiti Coast | 882,246 | 13.1% | 32.7% |
| Porirua | 880,410 | 9.4% | 27.5% |
| Upper Hutt | 818,060 | 12.3% | 29.9% |
| Lower Hutt | 856,569 | 11.2% | 25.5% |
| Wellington City | 1,085,924 | 10.2% | 21.3% |
| Wellington City - Central & South | 1,066,828 | 10.4% | 21.1% |
| Wellington City - East | 1,145,699 | 9.1% | 18.9% |
| Wellington City - North | 1,004,408 | 9.9% | 22.2% |
| Wellington City - West | 1,252,644 | 11.4% | 22.4% |
| Masterton | 578,655 | 7.9% | 35.6% |
| Carterton | 649,787 | 21.3% | 35.8% |
| South Wairarapa | 758,891 | 3.6% | 29.3% |
| Tasman | 746,515 | 10.5% | 17.4% |
| Nelson | 751,991 | 6.0% | 14.0% |
| Marlborough | 678,023 | 16.0% | 31.4% |
| Kaikoura | 524,533 | 1.1% | 13.4% |
| Buller | 247,675 | 5.5% | 15.7% |
| Grey | 271,649 | 9.3% | 17.8% |
| Westland | 321,510 | 9.5% | 19.8% |
| Hurunui | 479,702 | 10.6% | 17.1% |
| Waimakariri | 534,094 | 6.5% | 15.5% |
| Christchurch | 594,577 | 6.9% | 15.1% |
| Christchurch - Banks Peninsula | 645,194 | 8.2% | 16.1% |
| Christchurch - Central & North | 690,262 | 6.3% | 14.5% |
| Christchurch - East | 458,416 | 7.6% | 16.9% |
| Christchurch - Hills | 808,722 | 6.1% | 14.2% |
| Christchurch - Southwest | 564,074 | 7.1% | 14.7% |
| Selwyn | 644,690 | 7.1% | 14.2% |
| Ashburton | 428,779 | 7.5% | 15.0% |
| Timaru | 436,939 | 5.4% | 13.0% |
| MacKenzie | 626,702 | 7.4% | 4.2% |
| Waimate | 331,158 | 4.5% | 14.1% |
| Waitaki | 411,561 | 4.8% | 13.8% |
| Central Otago | 649,693 | 8.1% | 9.5% |
| Queenstown Lakes | 1,293,797 | 6.6% | 6.3% |
| Dunedin | 635,649 | 7.3% | 15.1% |
| Dunedin - Central & North | 659,815 | 8.2% | 16.5% |
| Dunedin - Peninsular & Coastal | 583,775 | 7.4% | 17.1% |
| Dunedin - South | 605,642 | 6.7% | 12.8% |
| Dunedin - Taieri | 656,236 | 6.5% | 14.5% |
| Clutha | 329,884 | 3.2% | 22.6% |
| Southland | 389,061 | 4.9% | 9.5% |
| Gore | 342,323 | 10.1% | 22.4% |
| Invercargill | 425,828 | 8.5% | 20.0% |
| Main Urban Areas | 990,930 | 7.7% | 17.6% |
| Auckland Region | 1,247,980 | 7.2% | 15.6% |
| Wellington Region | 971,393 | 10.5% | 23.7% |
| Total NZ | 871,375 | 8.1% | 18.4% |
| *Three month rolling average. | |||
79 Comments
So the stage is set for Reserve Bank Governor to go for DTI and banning Interest Only Loan to Investors as all data / information which are being released on a daily basis suggests that it is high time that Mr Orr acts and acts fast but will he !!!!
Will be interesting to see, what excuse he comes up with - Will he be silent on the issue or will he go for Wait and Watch approach
OR
Will he for a change do what he is suppose to do.
Agreed, however it was "high time" several months ago.
I think he will come up with an excuse, hope I'm wrong.
Orr only acts fast and hard when house prices stop rising
Not just for investors, for al borrowers alike, it makes no sense at all to protect only investors and not FHB or other OO
March government announced Housing Policy and also LVR was reintroduced STILL house price climbing up in April.
Will be interesting to know if Mr Orr decides not to go for Interest Only Loan (Reason why many are able to fund and support their speculative activities) and DTI can he spell out what data or parameter is he waiting for before trying to put a stop on speculative demand.
For Jacinda Arden, she went for Tax Change to remove undue advantage to investors so what is stopping her to ban interest only loan as is a much bigger advantage that Speculators have over FHB.
Besides Tax Change targeted all investor be it genuine investor or Speculators BUT interest Only will target mostly Speculators and that is also in line with her commitment to target speculative demand while trying to raise supply.
You don't understand interest only do you?
The only reason more investors choose these than owner occupiers is to allow max payments on own home (since mortgage interest on own home without boarders is not tax deductible) while allowing mortgage on investment properties to stay static as interest can be claimed as an expense (well up till Oct anyway).
Investors who have paid off own home, they will most likely not have any interest only as no point and paying down debt is always good.
No one goes interest only to "afford" repayments.
Banks test at time of application that the borrower can pay down the mortgage including principle at rates as high as 7% over a 25-30 year term.
Mother of god. Auckland east 1.8 and north shore coastal 1.6. How can this possibly be sustainable?
AC reckons it will double in a few years. You don’t need income when you have debt. I went to the Ralph Wiggum School of Economics like AC and Robbo.
3.6 mil next decade, 7.2 the one after, and 14.4 after that. Sustainable isn’t it?
Me fail economics? That’s unpossible!
Not so sure if top end prices are driven by speculators. I live in north Rodney and lifestyle property prices are now eye watering. Everything sells quickly, too. Most of the buyers are former Auckland city dwellers. I think Covid - pandemic fear, changing work practices, work-life balance etc have much to with this. I believe it’s also happening in the UK where country prices are outstripping urban ones.
It's not sustainable.
Average household income in nz is like 107k or something close to that & None of us have received a 4 to 40% pay rise over the past year.
Its just debt growth and prices need to reset back to 2019 levels.
Real terms - The stage is set for up market suburbs to boom over the next decade or two now we effectively have a Capital Gains tax as in the 10 year brightline tax. Look at any country where this has been introduced like the effect in Sydney, investors will just put more money into their private homes as it is still tax free, 1985 was the birth of super expensive upmarket suburbs in Sydney.
Real terms - The stage is set for up market suburbs to boom over the next decade or two now we effectively have a Capital Gains tax as in the 10 year brightline tax. Look at any country where this has been introduced like the effect in Sydney, investors will just put more money into their private homes as it is still tax free, 1985 was the birth of super expensive upmarket suburbs in Sydney.
lol
How extraordinary, this truly is the land of milk & honey. Well done NZ on our amazing success.
ho ho ho
It just goes from bad to worse. These are cringy figures.
Nifty
"I still get shocked"
The past is irrelevant.
A year ago Bitcoin was under $US9000 and today its $US58,000 - up 650%.
Anybody interested in Bitcoin or a house as a home or an investment property, it is about what is the future.
Being shocked about the past is wasted effort and a useless emotion.
Note: Nifty edited out “I’m shocked” since I wrote the above.
It's like that moive; "Scream" where old Ghost Face jumps out with a knife. 2021 is more like jumping out with a copy of the CoreLogic House Price Index.
I'm shocked at the present status of house values, not sure what past you're referring too? Some would say wasted energy is the time it took you to make your comment.
A year ago Bitcoin was under $US9000 and today its $US58,000 - up 650%.
Well looking at my Excel sheet, if you'd bought on March 19 2020, those BTC holdings would be up 956%.
All speculative and zero yield, great return nonetheless. Monitor using a spreadsheet
It's quite possible to earn 6.2% on those Bitcoin holdings through Celsius (https://celsius.network/). Spreadsheets are useful if you buy frequently, but my exchange also stores everything on CSV files.
The central banks and the banking system in general is responsible for all this. For every cloud, there is a silver lining I guess.
People buy so they can sell to others at inflated prices... present company excepted
People buy to diversify out if an inflating national currency with an intrinsic value of zero, to a finite supply decentralized digital store of value with an intrinsic value inversely correlated to Fiat.
People buy bitcoin because its hyper inflating and want to make money.
Also anything that can be created out thin air by a developer working in his garage is not Finite.
Future talk at the BBQ: "Yeah, remember when value of NZ homes rose by 43% in a year".
The past decade of considerable price increases are unsustainable and are now gone.
Anybody buying now expecting considerable capital gains in the short term are too late and have missed the party.
My kids will soon be in a position to buy their own homes. Still very viable now. So long as have deposit far cheaper of the two options, buy or rent
Very viable? lol. Any old sheet box is going for a million bucks plus. The banks have lost their heads and should have been reined in by now. They are enabling this insanity.
Low interest rates make it so... stay renting if you wish, but you will find yourself shelling out far more than those who are paying a mortgage. Do you think that renting is a viable alternative
I still can't see how that works. Whenever I muse with a mortgage calculator it comes out like 50% more than my rent, and that is taking on 30 years of servitude with all the interest rate risk for decades. No thanks.
1mii property 20% deposit 800k mortgage @2.25 is 18k a year
Market rent on that property is about $30k a year and going up
Principal is not an expense remember it is in fact forced savings but there’s plenty there for principal repayments and other expenses before your costs are what you are paying in rent
Why on earth would someone be a renter unless they were forced to be
OK thanks. Still doesn't add up for me. I used this: https://tools.anz.co.nz/home-loans/repayment-calculator
Plugged in 800k @2.25% and it comes to under [edit: under, not over] $37k p.a.
Rent for my AKL 3 bed rento is $27k.
I'm just surviving in AKL, so losing another $10k per year would finish me off - I'd be moving to Greymouth.
I acknowledge Yvil's comment below about owning at the end, but all these "it's cheaper to buy than rent" makes it sound like "look, the repayments are less than rent, stupid, so it's all upside". But it's not for me.
Add to that the rising interest rate risk, and rates, maintenance and insurance, and I've had 6 companies or projects die under me resulting in periods of redundancy consuming my savings (sure, that won't happen again!) and it's way too hard.
Man standing with eyes shut and shouting "I still can't see how that works". Lets see who talks about servitude etc when renters are forced to continue working and budgeting long after retirement
Rob that's because you include the repayment in your mortgage costs, which means at the end of your mortgage term yo have a mortgage free house while at the end of your rental term you have… nothing. The "x" years of servitude is a really bad way to look at it which will keep you poor.
To live in a house you either
1) pay rent and have nothing to your name in 10 - 20 - 30 years
2) pay a mortgage and have a house you own freehold = $1 million at least
I’d say the choice is between either a rock or a hard place at the moment. The idea that one should always buy a property regardless of the price is nuts. It’s that mentality that has people shelling out crazy money for a sheet box.
And that’s also the mentality why people rent their whole life and never end up owning anything.
But I take my hat off to you if you are happy doing that. I rented for years and it absolutely sucked.
" I rented for years and it absolutely sucked." The BJ you wish you could avoid
Viable? If you have hundreds of thousands in the bank sure. These prices are now like 12 to 15 times the average household income. Its ridiculous debt driven mania.
I just don't talk to my tenants about buying a house of their own. In the past 3 or 4 years only one has expressed any interest in buying a home. Quote "renting is paying less money that stacks up to more."
Tenants have zero risk in the coming housing market crash. Many of them have highly diversified assets and fast growing incomes. They used to say on wall street a house, what a deal..now you can say renting a house, what a deal. Where else in the world can you rent a million dollar house for less tham 3% roc and under 2% if you count the owners additional expenses like property taxes and depreciation. Its a steal.
" Many of them have highly diversified assets and fast growing incomes" if you say so but actually the bottom quartile of homes are where most renters live
"Where else in the world can you rent a million dollar house for less tham 3% roc and under 2%.... Its a steal." Sounds absolutely delightful. So why is it that there are vocal renters associations in the first place claiming everything that affects renters is so unfair and secondly why there are no similar associations for homeowner/occupiers
Its just another symptom. Those with the least often deserve our protection, because there is no honour in victory over the weak or temporarily disadvantaged.
Excuse me! EXCUSE ME!!!
Only minutes ago you made the claim "Many of them have highly diversified assets and fast growing incomes."
Now blindingly contradict yourself with "Those with the least often deserve our protection, because there is no honour in victory over the weak or temporarily disadvantaged."
Make your mind up please
No, I was talking about tenants in general, but you picked out a small subset of tenants at the bottom the heap. Obviously in your mind to be a tenant means you are automatically a member of some underclass. I'm a tenant, but I bet I'm worth more than you.
Ha, flex much?
I actually prefer tenants that are looking to buy their own house in a year's time. It avoids uncomfortable conversations if the rent is raised - just lift it between tenants.
Yes that is a good policy I might think about that. For that, you'd probably look for double income no kids, do you self-manage your rentals
Yes we do, we've tried using property managers and been very unimpressed. Meeting the tenants face-to-face creates a personal connection that one doesn't get through a manager, and subsequently fewer issues.
One more time for the DGMs!!!! Excellent news and helps further justify forthcoming rent increases. I will certainly be encouraging other property folk to vote red next election.
Housing increased significantly under Helen Clark's government too. Not sure why wannabee home buyers think voting Labour is a good idea. The next election is over 2 years away anyway..
I advise people to tell their grievances to their local MP. If no results are forthcoming buy 'An Appeal to Heaven' flag. There is another election in 2 and a bit years too. NZ is pretty socialist, so brace for more beggars on the streets.. best to make WORK your BEST Friend and not get discouraged - grinded under Labour's Marxist Wheels. It's never been easier to transfer NZD into other asset classes and currencies [BTC included].
Would be home owners shouldn’t vote Labour(?) But their campaign literature in 2017 stated that ‘only Labour has a comprehensive plan to fix the hosting crisis’. I’ve just woken up after 4 years frozen in carbonite: have they totally fixed it yet or is there still a wee way to go?
Carbonite is better than being a Lotus-Eater - welcome back. No, nothing is fixed.
When the government comes to your door saying, "we're here to fix your problems" close the door. When the government says they're going to build social housing by the 10's of thousands, that's socialism - "You'll Own Nothing AND Be Happy".
If policies disempower your populace, the people become dependent - dependent people aren't prosperous. Labour were doomed from the start.
Genuine question because I'm very tired this morning, but how does an increase in the value of a property purely through market movement justify raising the rent? I've only raised rent when costs have gone up or I've made improvements.
Because for some reason property investors determine their yield/return based on the current value, not what they've put into the investment.
If they paid $100k cash for a house and they're returning $10k in rent then that's a 10% return. But if the house doubles in price, despite still receiving 10% on their investment they're only "yielding" 5% on that $10k in rent. It's a bit strange.
Let's have a heart-to-heart. Why would RBNZ want to do anything to limit house prices? Basically they've made the 64% of New Zealanders who own 1+ houses far 'wealthier' allowing them to spend far above their income to keep our economy afloat.
When the crash eventually does come it will be savage but there is no need to hasten it and it's likely far too late to mitigate now. The crash will always be the one Governments and Reserve Banks engineered.
Why would you spend that cash and “keep the economy afloat” when you could pump it into another house?
Well if you build, you employ a builder, and if you buy existing you pay the lawyers and keep a couple of bankers in a job either way. Isn't that the 'economy'?
Lawyers and bankers doing well out of the Ponzi: what thought could be more comforting than that.
Jay Powell and Adrian Orr oil wrestling?
Sounds reasonable, Labour will of course need to crack-down on dissenters, which shouldn't be too hard considering their communist ideology. Just keep in mind, dissenter crack-down, NOT crime. Look out for wrong think/speech laws.
Dissenter
Thank you :) - fixed the spelling mistake lol :)
All good. Most dissenters are peripheral to status quo machinations, ergo decentered, so in a way both work.
I think he was actually informing on you as a dissenter. You are a counter-revolutionary and are a danger to the aims of the party. You will be stripped of your party membership and sent to a gulag for punishment / re-education.
They'll have to build a gulag first, I hear they're debating the definition of genocide as we speak! lol
lol come on, that's funny :)
I crack myself up sometimes
What would be good to see in parallel is average wages by region.
Milton Friedman - Public Housing:
I think these prices are a bit understated considering NZD has appreciated 18.9% against the USD in the past 12 months. So if you take that into account, it's even better.
Or worse, depending on your point of view.
Thanks for reminding how crazy was last year, worth mentioning also sales are struggling at these prices so better be ready for volatility. It would not be surprising at all the gains in the past 3 months would be gone in the next 3.
Not an unreasonable possibility.
Very interesting the latest Roy Morgan Research poll. Labour on 41.5% Greens 13.5%.
This means Labour would need green's support to from a govt. We all know what this can potentially mean.
We may have a renters revolt on our hands in a couple of years?
Council wants to rort oldies based on keeping to its own policy of staying at 80% market rent. https://i.stuff.co.nz/national/politics/local-democracy-reporting/30028…
The lady with the adorable cat is millenials future, only sans adorable cat, if they don't get out on the streets and start protesting and burning effigies
well it's not so much houses are worth more, it's the dollar is worth less, from inflation at 2% cough cough
modern monetary theory suggests printer goes brrrrrrrrr, decimal point shoots way to the right, fiat (worthless digital or printer government backed (taxpayer) promises of value) aint got no value if they just print more... hard assets, good crypto, houses, gold etc are hard to print hence they increase in value against something of no worth or backing... like how is the taxpayer going to pay off government debt? with some of their UBI (that's also printed) no maka the sensa
I'm a NZ permanent resident who left NZ for good in 2018 when my wife, NZ born daughter and I decided to move to Spain after 7 years renting in NZ.
I must admit every once in a while I check this site to see "if the property bubble has finally burst" and every time I talk to my wife about what would we had done if we remained in NZ. Buy? Rent?
Every time I'm glad I don't have to make that decision again. The way I see things is.. you guys are so deep in what you think it's the new normal that can't see things in perspective. The household income / salary rate in NZ makes it one of the most expensive countries to buy (if not the most) yet some still think it'll remain like that in 10, 20, 30 years? It's completely insane.
It's like expecting dogecoin to hold its value.
I know, I know. I thought in 2018 that the bubble was about to burst and here I am, still wrong. But the difficult part is not knowing it'll burst (it has to), it's knowing when.
Back then people used to blame foreign speculation, Chinese money. Well, what's the excuse now? I think flipping houses and thinking that renting is throwing away money is so deep in your DNA that young people still don't complain about how expensive buying is, but about "how difficult is to join the speculative ladder".
Does anybody even question the existence of a "ladder"?
When I think of my friends back in NZ, getting massive debts for wooden sheds I feel uncomfortable and I wonder how would they see my situation in Spain (or in so many other countries).
We bought an attic 4 bedroom apartment built in 2003 by the coast in a big city, community swimming pool, 5 min driving to the beach, schools, doctor, supermarket within minutes walking distance.
25% deposit, 10 years mortgage, 0.5% interest (Euribor is in negative now). The payments represent a 28% of my individual income. My salary is good, but, still, THIS is normal. NZs situation is not.
I bet many of you are now wondering why I don't buy another house.
Anyway. I'll check the site again in some months. Good luck, you'll need it.
Really interesting comment - thanks, and welcome back to the site. Sounds like, in retrospect, you made a good decision.
I moved to NZ in 67 and have spent a few years away but have lingered here for various reasons. To be honest, I feel like a hopeless loser - a rent slave falling behind by hundreds of dollars a day - but I have no way out that has a risk I can live with. I work hard, save (loser), live cheaply and keep my expectations of life low.
There is a desperate shortage of IT skills (my area) here but incomes are hardly surging, and cost of living is going up. I may just need to leave (or at least leave AKL) - holding on for now in case my luck changes.
"When" is indeed the big question. Here we are in the roaring 20s, again! Issuers of sovereign fiat always choose to destroy the currency rather than voluntarily accept deleverage (going bust), so a collapse is inevitable. At this stage there is little sign of angry revolution - just unhappiness and quite desperation. Even some home owners (winners) are in a bit of a bind - I just ran into a colleague who sold her house for a big profit but is struggling to buy back into the ponzi, despite having arranged a big pile of debt to take on (she said it makes sense because it's so cheap).
Bizarrely, Australia is in the same insane state, but NZ is so bad that Oz actually looks like a good deal and kiwis are trickling over there (my sense is especially to smaller cities, not SYD/MELB).
Enjoy sunny Spain - none of the above is your problem!
And btw - you will not need to check this site to know if the ''everything'' bubble has burst - it will burst on an unmissable planetary scale.
We welcome your comments below. If you are not already registered, please register to comment
Remember we welcome robust, respectful and insightful debate. We don't welcome abusive or defamatory comments and will de-register those repeatedly making such comments. Our current comment policy is here.