

The attractiveness of most types of residential properties as potential investments deteriorated in the fourth quarter (Q4) of last year, with declines in both gross rental yields and free cash flows.
The national indicative gross rental yield for three bedroom houses declined from 5.8% in Q3 last year to 5.6% in Q4.
The free cash flow, which is the amount of rental income left after the mortgage was paid, fell from $90 a week to $74 a week over the same period.
Interest.co.nz calculates gross rental yield and cash flow for the three main types of residential investment properties - three bedroom houses, two bedroom units/apartments and one bedroom unit/apartments, in each of the main urban districts throughout the country where there is significant rental activity.
This provides an apples-with-apples comparison of the relative attractiveness of residential property investment around the country and how that is changing over time.
The results are summarised in the three tables below, along with an explanation of the methodology used in the calculations.
Overall, they show both yields and cash flows deteriorated for three bedroom houses and two bedroom units/apartments between Q3 and Q$ last year, while one bedroom units/apartment were the stars of the show, posting not only much higher returns than other types of properties, but also an improvement between Q3 and Q4.
Of particular note are the very poor returns currently available from three bedrooms houses throughout the Auckland region.
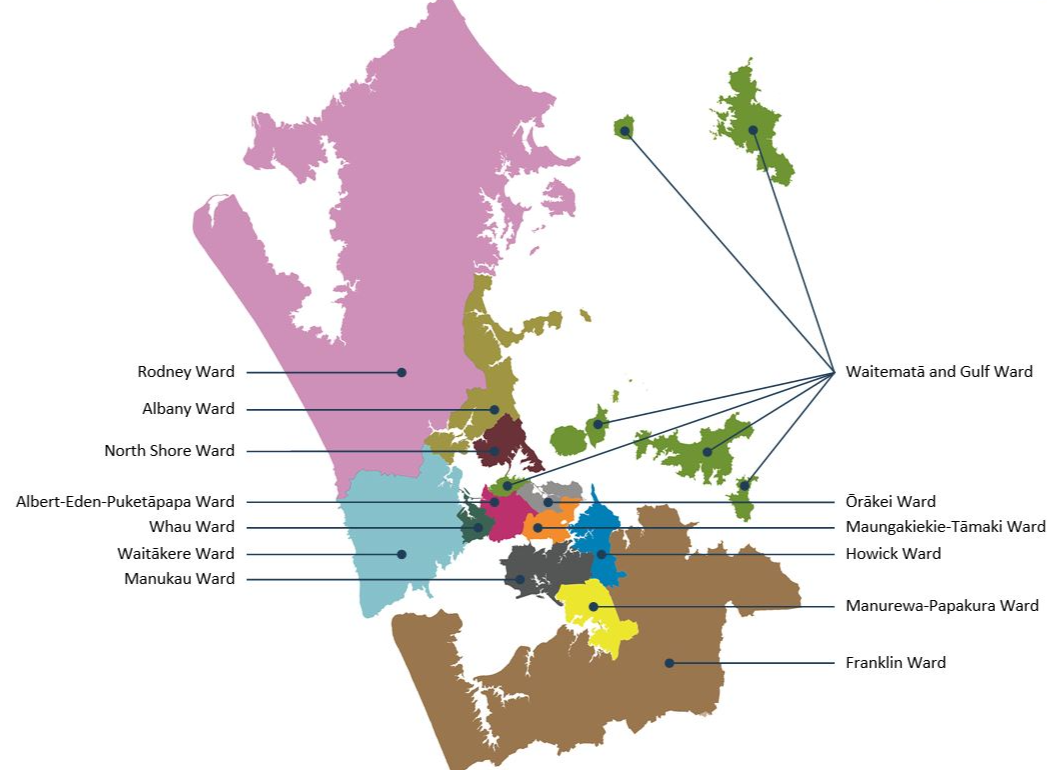
Not only are their rental yields low, ranging from 3.1% in Orakei Ward to 5.0% in Manurewa-Papakura Ward, but all areas have negative cash flow after the mortgage was paid. (A map of the ward areas is at the bottom of this article).
The situation for investors would be even worse than those numbers suggest, because the cash flow figures do not take into account the effect of periods of vacancy or of outgoings such as rates, insurance and repairs and maintenance.
So investors buying into three bedroom houses in Auckland would need to have deep pockets to meet the ongoing cash flow requirements of these properties.
It also means they would be entirely dependent on capital gain to actually make any money and that is far from certain in the current market.
The figures also show how vulnerable investors' cash flows could be when interest rates start rising again, which they will do at some stage.
The figures were better for two bedroom units/apartments, but still not great.
The national gross yield and cash flow both declined between Q3 and Q4, and although cash flow after mortgage payments remained positive in most areas, it was still so low that investors would likely only be left with loose change after paying their outgoings.
One bedroom units/apartment were the only property type in this set to show increases in gross rental yield and cash flow in Q4, to 9.2% and $205 a week respectively.
Those suggest investors might have a reasonable chance of actually making some money from their investment. But there are a couple of fish hooks to watch out for with one bedders, particularly in Auckland.
Many of the one bedroom units in central Auckland are so-called shoebox apartments, and the market for these can be fickle because it is very dependent on overseas student numbers.
And many of the Auckland CBD apartments in general are on leasehold titles.
The cash flows for leasehold properties can look staggeringly good until you take ground rent payments into account, then not so much.
And investors in leasehold properties can't fall back on the prospect of capital gains. Those will generally go to whoever owns the freehold.
The comment stream on this story is now closed.
| Indicative Gross Rental Yields and Cash Surplus/Deficit After Mortgage Paid on Residential Investment Properties* | ||||
| Q3 & Q4 2024 | ||||
| Three Bedroom House | ||||
| Gross Rental Yield | Cash Surplus/Deficit | |||
| Q3 2024 | Q4 2024 | Q3 2024 | Q4 2024 | |
| Whangarei District | 5.9% | 5.6% | $93 | $69 |
| Auckland Region | 4.6% | 4.4% | -$68 | -$92 |
| Rodney Ward | 4.0% | 3.6% | -$162 | -$253 |
| Albany Ward | 4.3% | 4.2% | -$129 | -$133 |
| North Shore Ward | 4.1% | 4.0% | -$160 | -$186 |
| Waitakere Ward | 4.5% | 4.4% | -$81 | -$94 |
| Waitemata and Gulf Ward | 3.3% | 3.5% | -$488 | -$384 |
| Whau Ward | 4.2% | 3.9% | -$126 | -$189 |
| Albert-Eden-Puketapapa Ward | 4.0% | 3.8% | -$192 | -$234 |
| Orakei Ward | 3.6% | 3.1% | -$338 | -$500 |
| Maungakiekie-Tamaki Ward | 4.1% | 4.0% | -$172 | -$173 |
| Howick Ward | 3.9% | 3.8% | -$197 | -$212 |
| Manukau Ward | 4.8% | 4.8% | -$29 | -$25 |
| Manurewa-Papakura Ward | 5.1% | 5.0% | $4 | -$2 |
| Franklin Ward | 4.7% | 4.7% | -$48 | -$37 |
| Hamilton City | 5.1% | 5.0% | $11 | $4 |
| Tauranga City | 4.9% | 5.0% | -$14 | -$6 |
| Whakatane District | 5.3% | 5.4% | $31 | $48 |
| Rotorua District | 6.6% | 5.9% | $147 | $94 |
| Taupo District | 5.3% | 5.1% | $33 | $16 |
| Hastings District | 6.7% | 5.5% | $162 | $57 |
| Napier City | 5.4% | 5.8% | $52 | $98 |
| New Plymouth District | 5.8% | 5.8% | $84 | $82 |
| Whanganui District | 6.7% | 6.4% | $135 | $118 |
| Palmerston North City | 6.1% | 5.8% | $103 | $86 |
| Kapiti Coast District | 5.2% | 4.7% | $22 | -$47 |
| Porirua City | 5.7% | 5.2% | $81 | $21 |
| Upper Hutt City | 5.5% | 5.6% | $55 | $81 |
| Lower Hutt City | 6.1% | 5.9% | $120 | $108 |
| Wellington City | 5.0% | 5.0% | $0 | -$4 |
| Nelson City | 5.1% | 5.0% | $15 | -$5 |
| Marlborough District | 5.5% | 5.5% | $49 | $51 |
| Waimakariri District | 5.1% | 5.0% | $11 | $2 |
| Christchurch City | 5.3% | 5.1% | $35 | $14 |
| Selwyn District | 4.8% | 4.7% | -$34 | -$38 |
| Ashburton District | 6.0% | 5.3% | $80 | $33 |
| Timaru District | 5.8% | 5.7% | $65 | $58 |
| Queenstown-Lakes District | 4.2% | 3.9% | -$182 | -$258 |
| Dunedin City | 5.9% | 6.0% | $88 | $96 |
| Invercargill City | 6.8% | 7.1% | $133 | $156 |
| All of Aotearoa | 5.8% | 5.6% | $90 | $74 |
| Two Bedroom Unit/Apartment | ||||
| Gross Rental Yield | Cash Surplus/Deficit | |||
| Q3 2024 | Q4 2024 | Q3 2024 | Q4 2024 | |
| Whangarei District | 6.2% | 6.3% | $91 | $100 |
| Auckland Region | 5.8% | 5.4% | $82 | $43 |
| Rodney Ward | 5.5% | n/a | $51 | n/a |
| Albany Ward | 4.4% | 4.8% | -$86 | -$22 |
| North Shore Ward | 4.4% | 4.4% | -$82 | -$78 |
| Waitakere Ward | 5.7% | 4.6% | $66 | -$47 |
| Waitemata and Gulf Ward | 18.9% | 10.0% | $441 | $300 |
| Whau Ward | 5.2% | 5.1% | $17 | $15 |
| Albert-Eden-Puketapapa Ward | 5.2% | 5.2% | $28 | $25 |
| Orakei Ward | 4.6% | 4.6% | -$68 | -$50 |
| Maungakiekie-Tamaki Ward | 5.9% | 5.5% | $94 | $63 |
| Howick Ward | 5.1% | 5.1% | $7 | $10 |
| Manukau Ward | 6.2% | 5.5% | $117 | $51 |
| Manurewa-Papakura Ward | 5.0% | 5.4% | $1 | $40 |
| Franklin Ward | 6.3% | n/a | $117 | n/a |
| Hamilton City | 6.0% | 5.0% | $90 | $1 |
| Tauranga City | 6.1% | 5.4% | $109 | $46 |
| Whakatane District | n/a | n/a | ||
| Rotorua District | 6.3% | 6.7% | $99 | $134 |
| Taupo District | n/a | n/a | ||
| Napier City | n/a | 6.7% | n/a | $150 |
| Hastings District | 7.1% | 5.6% | $173 | $52 |
| New Plymouth District | 7.3% | 5.2% | $163 | $15 |
| Whanganui District | 7.5% | 8.2% | $147 | $166 |
| Palmerston North City | 6.6% | n/a | $108 | n/a |
| Kapiti Coast District | 6.1% | n/a | $112 | n/a |
| Porirua City | 5.9% | n/a | $88 | n/a |
| Upper Hutt City | n/a | n/a | ||
| Lower Hutt City | 6.6% | 8.4% | $144 | $256 |
| Wellington City | 6.6% | 6.5% | $148 | $141 |
| Nelson City | 5.7% | 5.9% | $55 | $83 |
| Marlborough District | 6.3% | 5.7% | $96 | $57 |
| Waimakariri District | n/a | n/a | ||
| Christchurch City | 6.3% | 6.1% | $103 | $92 |
| Selwyn District | n/a | n/a | ||
| Ashburton District | n/a | n/a | ||
| Timaru District | 6.4% | 6.8% | $83 | $118 |
| Queenstown-Lakes District | 5.4% | 5.8% | $52 | $97 |
| Dunedin City | 6.8% | 6.4% | $128 | $106 |
| Invercargill City | 8.9% | 7.3% | $168 | $122 |
| All of Aotearoa | 7.3% | 6.7% | $184 | $150 |
| One Bedroom Unit/Apartment | ||||
| Gross Rental Yield | Cash Surplus/Deficit | |||
| Q3 2024 | Q4 2024 | Q3 2024 | Q4 2024 | |
| Whangarei District | 6.2% | 5.6% | $75 | $44 |
| Auckland Region | 9.9% | 10.7% | $232 | $250 |
| Rodney Ward | n/a | n/a | ||
| Albany Ward | 4.9% | 4.5% | -$11 | -$59 |
| North Shore Ward | 5.8% | 5.0% | $65 | $4 |
| Waitakere Ward | n/a | n/a | ||
| Waitemata and Gulf Ward | 19.5% | 19.2% | $334 | $333 |
| Whau Ward | 6.5% | 8.3% | $106 | $183 |
| Albert-Eden-Puketapapa Ward | 6.2% | 6.7% | $95 | $125 |
| Orakei Ward | 5.4% | 7.5% | $38 | $182 |
| Maungakiekie-Tamaki Ward | 6.1% | 6.3% | $108 | $118 |
| Howick Ward | 5.4% | 5.3% | $36 | $30 |
| Manukau Ward | 6.7% | 7.5% | $107 | $142 |
| Manurewa-Papakura Ward | n/a | 5.7% | n/a | $50 |
| Franklin Ward | n/a | n/a | ||
| Hamilton City | 6.3% | $71 | ||
| Tauranga City | 6.7% | 5.4% | $116 | $44 |
| Whakatane District | n/a | n/a | ||
| Rotorua District | n/a | n/a | ||
| Taupo District | n/a | n/a | ||
| Napier City | n/a | n/a | ||
| Hastings District | 5.5% | 4.7% | $38 | -$20 |
| New Plymouth District | 9.0% | 6.8% | $199 | $111 |
| Whanganui District | n/a | n/a | ||
| Palmerston North City | n/a | 5.2% | n/a | $13 |
| Kapiti Coast District | n/a | n/a | ||
| Porirua City | n/a | n/a | ||
| Upper Hutt City | n/a | n/a | ||
| Lower Hutt City | 6.4% | 11.8% | $92 | $273 |
| Wellington City | 8.2% | 11.1% | $180 | $259 |
| Nelson City | 3.9% | 5.2% | -$120 | $14 |
| Marlborough District | n/a | n/a | ||
| Waimakariri District | n/a | n/a | ||
| Christchurch City | 5.8% | 6.7% | $55 | $105 |
| Selwyn District | n/a | n/a | ||
| Ashburton District | n/a | n/a | ||
| Timaru District | n/a | n/a | ||
| Queenstown-Lakes District | 9.6% | 7.2% | $263 | $160 |
| Dunedin City | 6.5% | 6.7% | $92 | $119 |
| Invercargill City | n/a | n/a | ||
| All of Aotearoa | 8.7% | 9.2% | $190 | $205 |
| Notes:* The Gross Rental Yield is based on purchasing a property at the REINZ's lower quartile selling price for each type of property in each district, and the median rent for the same types of properties in the same district sourced from Tenancy Services bond data. Cash surplus/deficit is the amount of rental income remaining after the mortgage has been paid. This assumes the property was purchased with a 40% deposit, with the mortgage payments calculated using interest rates of 5.68% in Q3 and 5.61% in Q4, both for 20 year terms. Both the yield and cash flow figures make no allowances for periods of vacancy, or outgoings such as rates, insurance or repairs and maintenance. Property details are marked n/a (not available) when there were two few of the particular type of property sold and/or rented during the quarter to produce reliable data. | ||||
Auckland Council Wards
We welcome your comments below. If you are not already registered, please register to comment
Remember we welcome robust, respectful and insightful debate. We don't welcome abusive or defamatory comments and will de-register those repeatedly making such comments. Our current comment policy is here.