
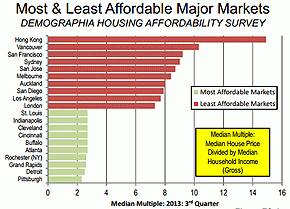
Today's release by Demographia of their 10th annual survey of 'median multiples' shows that New Zealand housing is 'severely unaffordable' when compared to international benchmarks.
The median multiple view relates household income to median house prices.
This Report is important because it is enables international benchmarking.
According to the survey "third quarter" 2013 New Zealand national median house prices were 5.5 times higher than "median household incomes".
The Report says this about New Zealand:
New Zealand's only major metropolitan market, Auckland, is severely unaffordable, with a Median Multiple of 8.0 (Table 11). Auckland ranks as the seventh most unaffordable among the 85 existing major markets.
Auckland, like Australia's five major metropolitan markets, has been rated severely unaffordable in all 10 Demographia International Housing Affordability Surveys.
Overall, housing in New Zealand was severely unaffordable, with a Median Multiple of 5.5.
23 Six of New Zealand's markets were severely unaffordable, while two markets were seriously unaffordable.
Outside of Auckland, Tauranga-Western Bay of Plenty was the most unaffordable, with a Median Multiple of 6.6.
The second and third largest markets were severely unaffordable, with Christchurch at 5.8, and Wellington at 5.4.
Two markets were seriously unaffordable, Palmerston North-Manawatu, at 4.5 and Hamilton-Waikato, at 4.8
| Median multiple | 2004 | 2005 | 2006 | 2007 | 2008 | 2009 | 2010 | 2011 | 2012 | 2013 |
| Auckland | 6.6 | 6.9 | 6.9 | 6.4 | 6.7 | 6.4 | 6.4 | 6.7 | 8.0 | |
| Christchurch | 5.9 | 6.0 | 6.6 | 6.1 | 6.1 | 6.0 | 6.3 | 6.6 | 5.8 | |
| Dunedin | 5.3 | 5.5 | 5.6 | 5.0 | 5.2 | 5.1 | 5.2 | |||
| Hamilton-Waikato | 6.3 | 5.2 | 5.0 | 5.0 | 4.8 | 4.7 | 4.8 | |||
| Napier-Hastings | 5.7 | 5.2 | 5.0 | 4.7 | 4.8 | 4.5 | 5.4 | |||
| Palm Nth/Manawatu | 4.9 | 4.6 | 4.1 | 4.1 | 4.4 | 4.5 | ||||
| Tauranga/WBOP | 7.5 | 6.6 | 6.8 | 6.5 | 5.9 | 5.9 | 6.6 | |||
| Wellington | 5.2 | 5.4 | 6.1 | 5.9 | 5.8 | 5.5 | 5.1 | 5.4 | 5.5 | |
| New Zealand | 5.9 | 6.0 | 6.3 | 5.7 | 5.7 | 5.3 | 5.2 | 5.3 | 5.5 |
The definition of "household income" is an issue for this international survey. It is a mish-mash of every income source New Zealand families have for every range of age group. It includes wages, salaries, unemployment income, pension payments, dividends, interest, self employment income, and benefits.
And that income is 'gross' before tax. Over the period, we have had three tax cuts, and the effect of these is not included in the results.
Demographia 'income' measurements have jumped around a lot over the years, even indicating household incomes are falling at times.
| Household income | 2004 | 2005 | 2006 | 2007 | 2008 | 2009 | 2010 | 2011 | 2012 | 2013 |
| NZ$(000) per year | ||||||||||
| Auckland | 57.8 | 57.5 | 65.0 | 67.3 | 68.5 | 69.6 | 70.5 | 75.2 | 70.6 | |
| Christchurch | 46.5 | 48.4 | 49.4 | 51.1 | 52.1 | 55.6 | 55.9 | 54.2 | 66.5 | |
| Dunedin | 44.0 | 45.5 | 45.8 | 49.9 | 47.9 | 49.8 | 51.1 | |||
| Hamilton-Waikato | 56.4 | 58.4 | 58.1 | 61.9 | 62.7 | 63.9 | 62.8 | |||
| Napier-Hastings | 49.7 | 52.7 | 52.4 | 57.5 | 55.2 | 57.1 | 54.2 | |||
| Palm Nth/Manawatu | 50.6 | 51.1 | 57.1 | 56.8 | 55.1 | 50.9 | ||||
| Tauranga/WBOP | 48.8 | 52.1 | 51.9 | 54.6 | 56.6 | 59.6 | 55.0 | |||
| Wellington | 57.4 | 61.4 | 61.2 | 63.3 | 65.9 | 71.9 | 72.0 | 70.6 | 70.4 |
An alternative way to think about household income is to use the Statistics NZ LEEDS series, focus on the main house-buying age (30-34 yrs) and use take-home pay (after tax) for a two adult, one child family. We do that here and update monthly.
We welcome your comments below. If you are not already registered, please register to comment
Remember we welcome robust, respectful and insightful debate. We don't welcome abusive or defamatory comments and will de-register those repeatedly making such comments. Our current comment policy is here.