
In the year to September, 1.2 million cubic metres of ready mixed concrete was poured for projects across the Auckland region.
This was 31.6% of the 3.8 mln cubic meters poured nationwide in the same year.
In Christchurch, the annual total was 787,200 m3, or 20.6% of the national total.
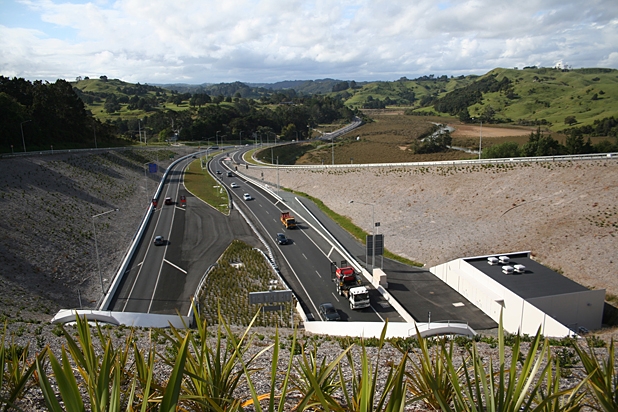
However, what makes the Auckland activity special is that it gives a clue into the development on the city's fringes.
The outer regions include Whangaparoa, Wellsford, Pukekohe, and Waiuku.
| Auckland readymix concrete | Region | Metro | Outer | % |
| m3 | m3 | m3 | ||
| September, 2014 | 312,088 | 224,256 | 87,832 | 28.1% |
| December | 296,923 | 214,354 | 82,569 | 27.8% |
| March, 2015 | 288,280 | 206,717 | 81,563 | 28.3% |
| June | 306,832 | 215,688 | 91,144 | 29.7% |
| September | 312,364 | 217,054 | 95,310 | 30.5% |
| -------------- | ------------ | ------------ | --------- | |
| Annual to September | 1,204,399 | 853,813 | 350,856 | 29.1% |
Infrastructure and new housing development outside the metropolitan area is drawing concrete at an increasing rate. At 95,300 m3, September pour levels were +8% higher in 2015 than the same quarter a year ago.
The level of concrete being poured in these fringe Auckland regions is now about twice the level of all pourings in Wellington.
The Statistics NZ data released today was with a "100% response rate" from the industry survey.
Readymix concrete
Select chart tabs
(Correction: An earlier version of this story had the September 2014 splits in error.)
We welcome your comments below. If you are not already registered, please register to comment
Remember we welcome robust, respectful and insightful debate. We don't welcome abusive or defamatory comments and will de-register those repeatedly making such comments. Our current comment policy is here.