
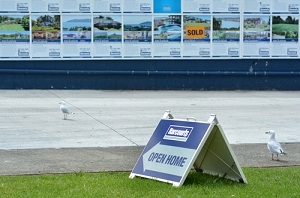
Harcourts average selling price dropped for the second month in a row in November, led mainly by declines in Auckland.
The average price of all homes sold by the real estate agency last month was $505,738, compared with $514,632 in October and $539,961 in September.
In Auckland the average selling price was $815,438 in November compared to $822,604 in October and $841,502 in September, giving a decline of 3.1% over the last two months.
However the average Auckland selling price of $815,438 in November remained up $104,942, or 15%, on the average price in November 2014 when it was a comparatively modest $710,496.
Around the rest of the country prices appeared to be relatively stable in November.
Harcourts sold 2203 homes throughout the country in November, which was up 51, or 2.4%, on the 2152 it sold in October, and 95, or 4.5%, higher than the 2108 it sold in November last year.
In Auckland the company sold 582 homes in November, which was up on the 533 it sold in September but well down from the 676 it sold in November last year.
Harcourts chief executive Chris Kennedy said although the market had slowed towards the end of the year, particularly in Auckland, there was no cause for alarm.
"The new LVR rules for Auckland and the bright line test for investors have had an impact on the market, but I believe it will be short term," he said.
" It appears some buyers are taking an early summer break while they consider the impact of those new rules."
"And that only really applies to Auckland.
"In the rest of the country things are humming along nicely with good sales and prices across the board," he said.
See the table below for Harcourts' sales results from throughout the country:
Harcourts Residential Property Sales |
||||
| November 2014 | September 2015 | October 2015 | November 2015 | |
| Auckland/Northland | ||||
| Average price | $710,496 | $841,502 | $822,604 | $815,438 |
| Number of sales | 676 | 636 | 533 | 582 |
| Central NI (incl. BoP & Waikato) | ||||
| Average price | $329,469 | $363,586 | $376,205 | $372,792 |
| Number of sales | 389 | 551 | 545 | 501 |
| Wellington and Lower NI | ||||
| Average price | $387,566 | $362,511 | $385,756 | $386,151 |
| Number of sales | 346 | 332 | 335 | 355 |
| Christchurch | ||||
| Average price | $488,515 | $511,703 | $516,168 | $510,926 |
| Number of sales | 445 | 459 | 463 | 473 |
| Rest of SI (excl. Chch) | ||||
| Average price | $356,143 | $318,631 | $326,266 | $323,607 |
| Number of sales | 230 | 310 | 256 | 268 |
| Total NZ | ||||
| Average price | $494,230 | $539,961 | $514,632 | $505,738 |
| Number of sales | 2108 | 2316 | 2152 | 2203 |
We welcome your comments below. If you are not already registered, please register to comment
Remember we welcome robust, respectful and insightful debate. We don't welcome abusive or defamatory comments and will de-register those repeatedly making such comments. Our current comment policy is here.