Content supplied by RLB
Rider Levett Bucknall’s Q2 2016 RLB Crane Index® released today highlights the strength of the Auckland construction industry, which shows no signs of abating.
The RLB Crane Index® tracks the number of cranes in the significant centres of mainland New Zealand. The crane count provides a good, simple indication of new building activity as well as general economic activity in each of these locations.
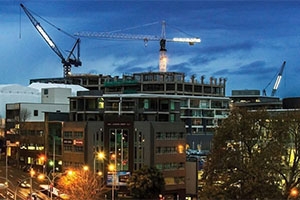
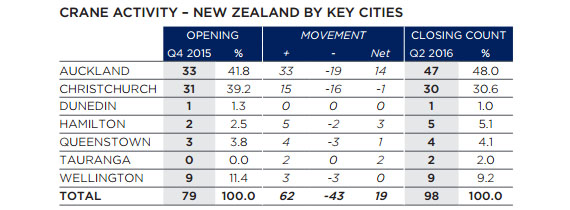
A record 47 cranes currently tower across Auckland’s skyline since the RLB Crane Index commenced in Q2 2014. During the past 6 months, 33 new tower cranes have been erected whilst 19 have been dismantled as site work on construction projects came to an end. That’s a net increase of 14 cranes since Q4 2015’s 33 cranes.
Mr. Chris Haines, Rider Levett Bucknall’s Auckland Director commented, “The construction industry in Auckland is now stretching the supply chain across the North Island. There remains resource and supply concerns with the likely increase in the future workload with the NZ National Convention Centre and City Rail Link now under way and the redevelopment of Commercial Bay at the Downtown shopping centre soon to commence.”
“As a way to cope with this high level of contractor demand, we are seeing an increasingly active Australian contingent of main contractors, sub-contractors working in the Auckland market, in turn putting pressure on the Aussie supply chain.”
With the release of the 5th edition, RLB has commenced the indexing of crane activity across New Zealand. This indexing enables the historical crane activity in all key cities to be graphically represented. The 3rd edition of the RLB Crane Index® (Q2 2014) has been used as the reference date for the calculation of the index.
The RLB Crane Index® shows that since the reference period, Auckland has seen a crane activity increase of 88%, Christchurch of 36% with Wellington showing 50%. Crane activity in New Zealand as a whole increased by 38% during this period.
Mr. Chris Haines continued, “The Q2 2016 RLB Crane Index® has identified a total of 98 cranes currently erected across New Zealand, an increase of 19 or 24% increase in number since Q4 2015.Auckland accounted for 14 of the additional cranes in New Zealand.”
“A total of 62 cranes have been commissioned since our last Crane Index with 43 removed across the country. Auckland and Christchurch account for over 78% of New Zealand cranes. Hamilton, Queenstown and Tauranga all showed crane numbers increasing with Dunedin and Wellington steady,” he said.
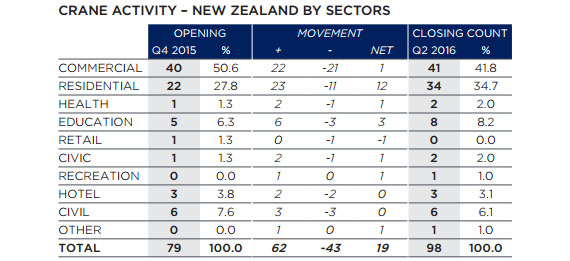
According to the 2Q 2016 RLB Crane Index, the strength of the residential sector across New Zealand is seen by the addition of 12 cranes. This increase represents 63% of the new cranes observed. The residential sector now accounts for 35% of all cranes working in New Zealand, up from 28% previously.
The commercial sector accounts for 42% of all cranes, down from 51% previously. Commercial projects have 41 cranes, slightly down from 40 at the last Crane Index. The Education and Civil sectors are the next largest with eight and six cranes respectively.
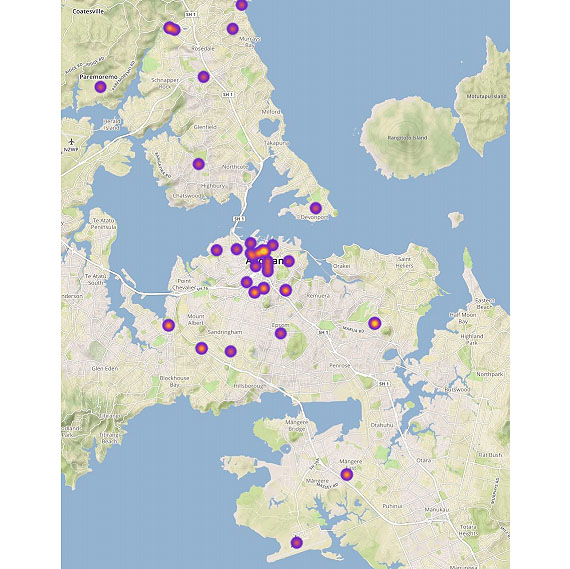
As a new initiative, the RLB Crane Index® hotspots map offer a pictorial representation of the collected data for each city using a heat map indicator to indicate the level of crane activity.
The full report is here. You can find an updated list of major Auckland projects here.
We welcome your comments below. If you are not already registered, please register to comment
Remember we welcome robust, respectful and insightful debate. We don't welcome abusive or defamatory comments and will de-register those repeatedly making such comments. Our current comment policy is here.