
House price gains are continuing to grind to a halt in the Auckland area but things remain buoyant in some other parts of the country.
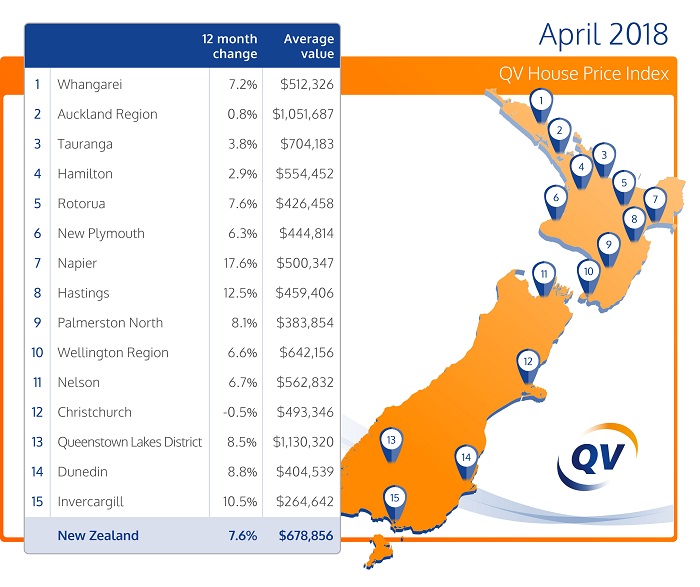
According to Quotable Value, the average value of nationwide residential property values for April increased by 7.6% over the past year (up from 7.3% as of March). The nationwide average value is now $678,856. When adjusted for inflation the nationwide annual increase drops slightly to 6.4%.
Meanwhile, residential property value growth across the Auckland Region increased by just 0.8% year on year (down from 1% as of March). A year ago the Auckland region was experiencing annual house price growth of 10.7% - and that was then the slowest rate since 2014.
The average value for the Auckland Region is now $1,051,687. When adjusted for inflation values actually dropped 0.3% over the past year.
QV general manager David Nagel said many regional centres were continuing to see steady increases in price, "while the rate of growth continues to slow, plateau or even drop slightly in the main centres".
He thought this was partly due to a continued trend of people seeking a lifestyle change away from the cities and purchasing better-valued properties in the regions, particularly those regions that are within commutable distances of major centres.
Nagel said annual value growth also remained flat in Christchurch, while the Hamilton, Tauranga and Dunedin markets continued to rise moderately.
"The slowdown in value growth can be partly attributed to the usual seasonal slowdown in activity as we approach the winter months and also the fact that many people, particularly investors, are not expecting significant capital growth in the coming months so are less active in the market.
“Despite the fact that home values remain high, first home buyer activity is increasing particularly in Wellington and Dunedin – as people take advantage of their KiwiSaver funds as deposits.
"The higher proportion of first home buyer actively is largely due to rising rents which mean it can often be as affordable to purchase an entry level home and pay a mortgage, as it is to rent a home.
"However, for many, raising a deposit is still a bridge too far to cross to be able to gain entry into the housing market."
QV says that values across the Auckland market are varying, although not significantly. North Shore values rose 3.2% in the year to April, with an average value there now $1,233, 394. The former Auckland City Council central suburbs rose 0.6% year on year and the average value there is now $1,086,879. Waitakere values dropped 0.2% year on year. Manukau dropped by 0.3% year on year; Papakura values rose 1.1% year on year a and the average value there is now $701,123; Franklin values also rose 0.2% year on year and Rodney values were also up 0.1% year on year.
QV Auckland senior consultant, James Steele said there is still a good amount of activity taking place across Auckland, however, values remain flat. "We are seeing strong interest from first home buyers, who are making the most of a drop in investor activity, and a slight easing of lending criteria and relatively low interest rates.
"A number of first home buyers are targeting the sub-$600k price bracket in order to obtain the KiwiSaver HomeStart grant but those unwilling to compromise on size or locations are finding these criteria difficult to meet.
"Listings are staying on the market for a longer period of time and fewer properties are going at auction, providing more opportunity to negotiate and place conditional offers which is benefiting buyers."
Hamilton City home values increased 2.9% in the year to April. The average value in Hamilton is now $554,452 and QV Hamilton property consultant Andrew Jaques said, overall, "it’s a steady market".
Tauranga home values rose 3.8% year on year and the average value in the city is $704,183. The Western Bay of Plenty market rose 6.8% year on year and 2.2% over the past three months. The average value in the district is now $630,703.
QV Tauranga property consultant, Steven Dunn said Tauranga continues to see good interest especially for those looking to purchase in the higher price bracket as well as from first home buyers.
"However, across the board values appear to have stabilised and we continue to see buyers are taking longer to complete due diligence before purchasing."
Wellington had an annual rate of growth of 6.6%. The average value is now $642,156.
QV Wellington senior consultant, David Cornford said market conditions in Wellington are pretty stable with modest value growth.
“The number of days to sell has increased slightly but is still significantly lower than the long term average and overall the market is robust.”
Christchurch City values continue recent trends, either remaining flat or seeing slight increases or decreases in value. Values dropped slightly by 0.5% year on year with the average value in the city now $493,346.
QV Christchurch property consultant Hamish Collins said the market remains steady in terms of value growth.
"Well-maintained property continues to sell well although this is often dependent on the seller being willing to negotiate on price. We are observing that discounts are being offered on a good portion of properties that are sold although these discounts are not overly substantial."
Values in Dunedin continue their upward trend having increased 8.8% in the year to April, with the average value in the city at $404,539.
QV Dunedin property consultant, Aidan Young said the market has slowed but values remain stable overall and there appears to be a bit of a mixed sentiment.
"Dunedin continues to provide a lower entry point when compared to many other parts of New Zealand."
See below for the average dwelling prices in all parts of the country and their movements over the 12 months to April.
QV House Price Index - April 2018
| Territorial authority | Average current value | 12 month change% |
| Auckland Region | 1,051,687 | 0.8% |
| Wellington Region | 642,156 | 6.6% |
| Main Urban Areas | 794,929 | 6.5% |
| Total New Zealand Nationwide | 678,856 | 7.6% |
| Far North | 429,640 | 6.9% |
| Whangarei | 512,326 | 7.2% |
| Kaipara | 524,681 | 6.4% |
| Auckland - Rodney | 958,130 | 0.1% |
| Rodney - Hibiscus Coast | 939,821 | 1.0% |
| Rodney - North | 977,649 | -0.9% |
| Auckland - North Shore | 1,233,394 | 3.2% |
| North Shore - Coastal | 1,418,758 | 3.6% |
| North Shore - Onewa | 971,425 | 2.4% |
| North Shore - North Harbour | 1,214,201 | 3.0% |
| Auckland - Waitakere | 824,631 | -0.2% |
| Auckland - City | 1,232,850 | 0.8% |
| Auckland City - Central | 1,086,879 | 0.6% |
| Auckland_City - East | 1,550,784 | 1.8% |
| Auckland City - South | 1,090,785 | -0.7% |
| Auckland City - Islands | 1,142,511 | 7.6% |
| Auckland - Manukau | 900,095 | -0.3% |
| Manukau - East | 1,152,825 | -1.7% |
| Manukau - Central | 697,708 | 2.4% |
| Manukau - North West | 778,373 | 0.3% |
| Auckland - Papakura | 701,123 | 1.1% |
| Auckland - Franklin | 670,785 | 0.2% |
| Thames Coromandel | 727,825 | 5.4% |
| Hauraki | 390,049 | 10.7% |
| Waikato | 478,199 | 6.3% |
| Matamata Piako | 434,872 | 6.1% |
| Hamilton | 554,452 | 2.9% |
| Hamilton - North East | 700,007 | 2.5% |
| Hamilton - Central & North West | 513,328 | 2.1% |
| Hamilton - South East | 503,222 | 2.8% |
| Hamilton - South West | 492,644 | 3.7% |
| Waipa | 536,369 | 7.1% |
| Otorohanga | 310,287 | 21.0% |
| South Waikato | 227,230 | 14.6% |
| Waitomo | 189,539 | 12.1% |
| Taupo | 469,232 | 7.1% |
| Western BOP | 630,703 | 6.8% |
| Tauranga | 704,183 | 3.8% |
| Rotorua | 426,458 | 7.6% |
| Whakatane | 427,494 | 9.0% |
| Kawerau | 193,629 | 8.8% |
| Opotiki | 316,431 | 10.9% |
| Gisborne | 310,283 | 10.9% |
| Wairoa | 168,881 | 1.5% |
| Hastings | 459,406 | 12.5% |
| Napier | 500,347 | 17.6% |
| Central Hawkes Bay | 315,767 | 19.8% |
| New Plymouth | 444,814 | 6.3% |
| Stratford | 261,449 | 11.8% |
| South Taranaki | 220,658 | 10.3% |
| Ruapehu | 185,261 | 11.5% |
| Whanganui | 244,293 | 10.9% |
| Rangitikei | 201,728 | 9.0% |
| Manawatu | 335,839 | 11.2% |
| Palmerston North | 383,854 | 8.1% |
| Tararua | 192,245 | 8.5% |
| Horowhenua | 308,273 | 15.6% |
| Kapiti Coast | 556,894 | 13.4% |
| Porirua | 548,008 | 7.3% |
| Upper Hutt | 486,862 | 9.3% |
| Hutt | 537,556 | 6.8% |
| Wellington | 761,400 | 5.1% |
| Wellington - Central & South | 755,217 | 4.7% |
| Wellington - East | 813,497 | 3.6% |
| Wellington - North | 687,873 | 6.3% |
| Wellington - West | 882,892 | 5.2% |
| Masterton | 338,665 | 16.4% |
| Carterton | 387,727 | 17.6% |
| South Wairarapa | 477,960 | 23.0% |
| Tasman | 565,906 | 8.5% |
| Nelson | 562,832 | 6.7% |
| Marlborough | 457,935 | 6.9% |
| Kaikoura | N/A | N/A |
| Buller | 179,227 | -4.8% |
| Grey | 212,262 | 0.6% |
| Westland | 246,411 | 3.5% |
| Hurunui | 389,074 | 5.1% |
| Waimakariri | 441,774 | 0.0% |
| Christchurch | 493,346 | -0.5% |
| Christchurch - East | 369,448 | -0.4% |
| Christchurch - Hills | 662,855 | -1.4% |
| Christchurch - Central & North | 580,031 | -0.9% |
| Christchurch - Southwest | 475,337 | 0.0% |
| Christchurch - Banks Peninsula | 513,244 | 2.5% |
| Selwyn | 550,036 | 0.9% |
| Ashburton | 352,568 | 1.4% |
| Timaru | 355,389 | 6.0% |
| MacKenzie | 510,957 | 12.1% |
| Waimate | 236,036 | 7.3% |
| Waitaki | 304,665 | 13.8% |
| Central Otago | 488,488 | 12.4% |
| Queenstown Lakes | 1,130,320 | 8.5% |
| Dunedin | 404,539 | 8.8% |
| Dunedin - Central & North | 418,991 | 8.8% |
| Dunedin - Peninsular & Coastal | 368,480 | 6.4% |
| Dunedin - South | 386,807 | 9.8% |
| Dunedin - Taieri | 419,638 | 8.8% |
| Clutha | 213,369 | 12.5% |
| Southland | 273,561 | 10.3% |
| Gore | 228,934 | 9.1% |
| Invercargill | 264,642 | 10.5% |
No chart with that title exists.
We welcome your comments below. If you are not already registered, please register to comment
Remember we welcome robust, respectful and insightful debate. We don't welcome abusive or defamatory comments and will de-register those repeatedly making such comments. Our current comment policy is here.