
It's a buyer's market in Auckland for the start of summer, with the number of homes for sale up strongly and average asking prices and property values down.
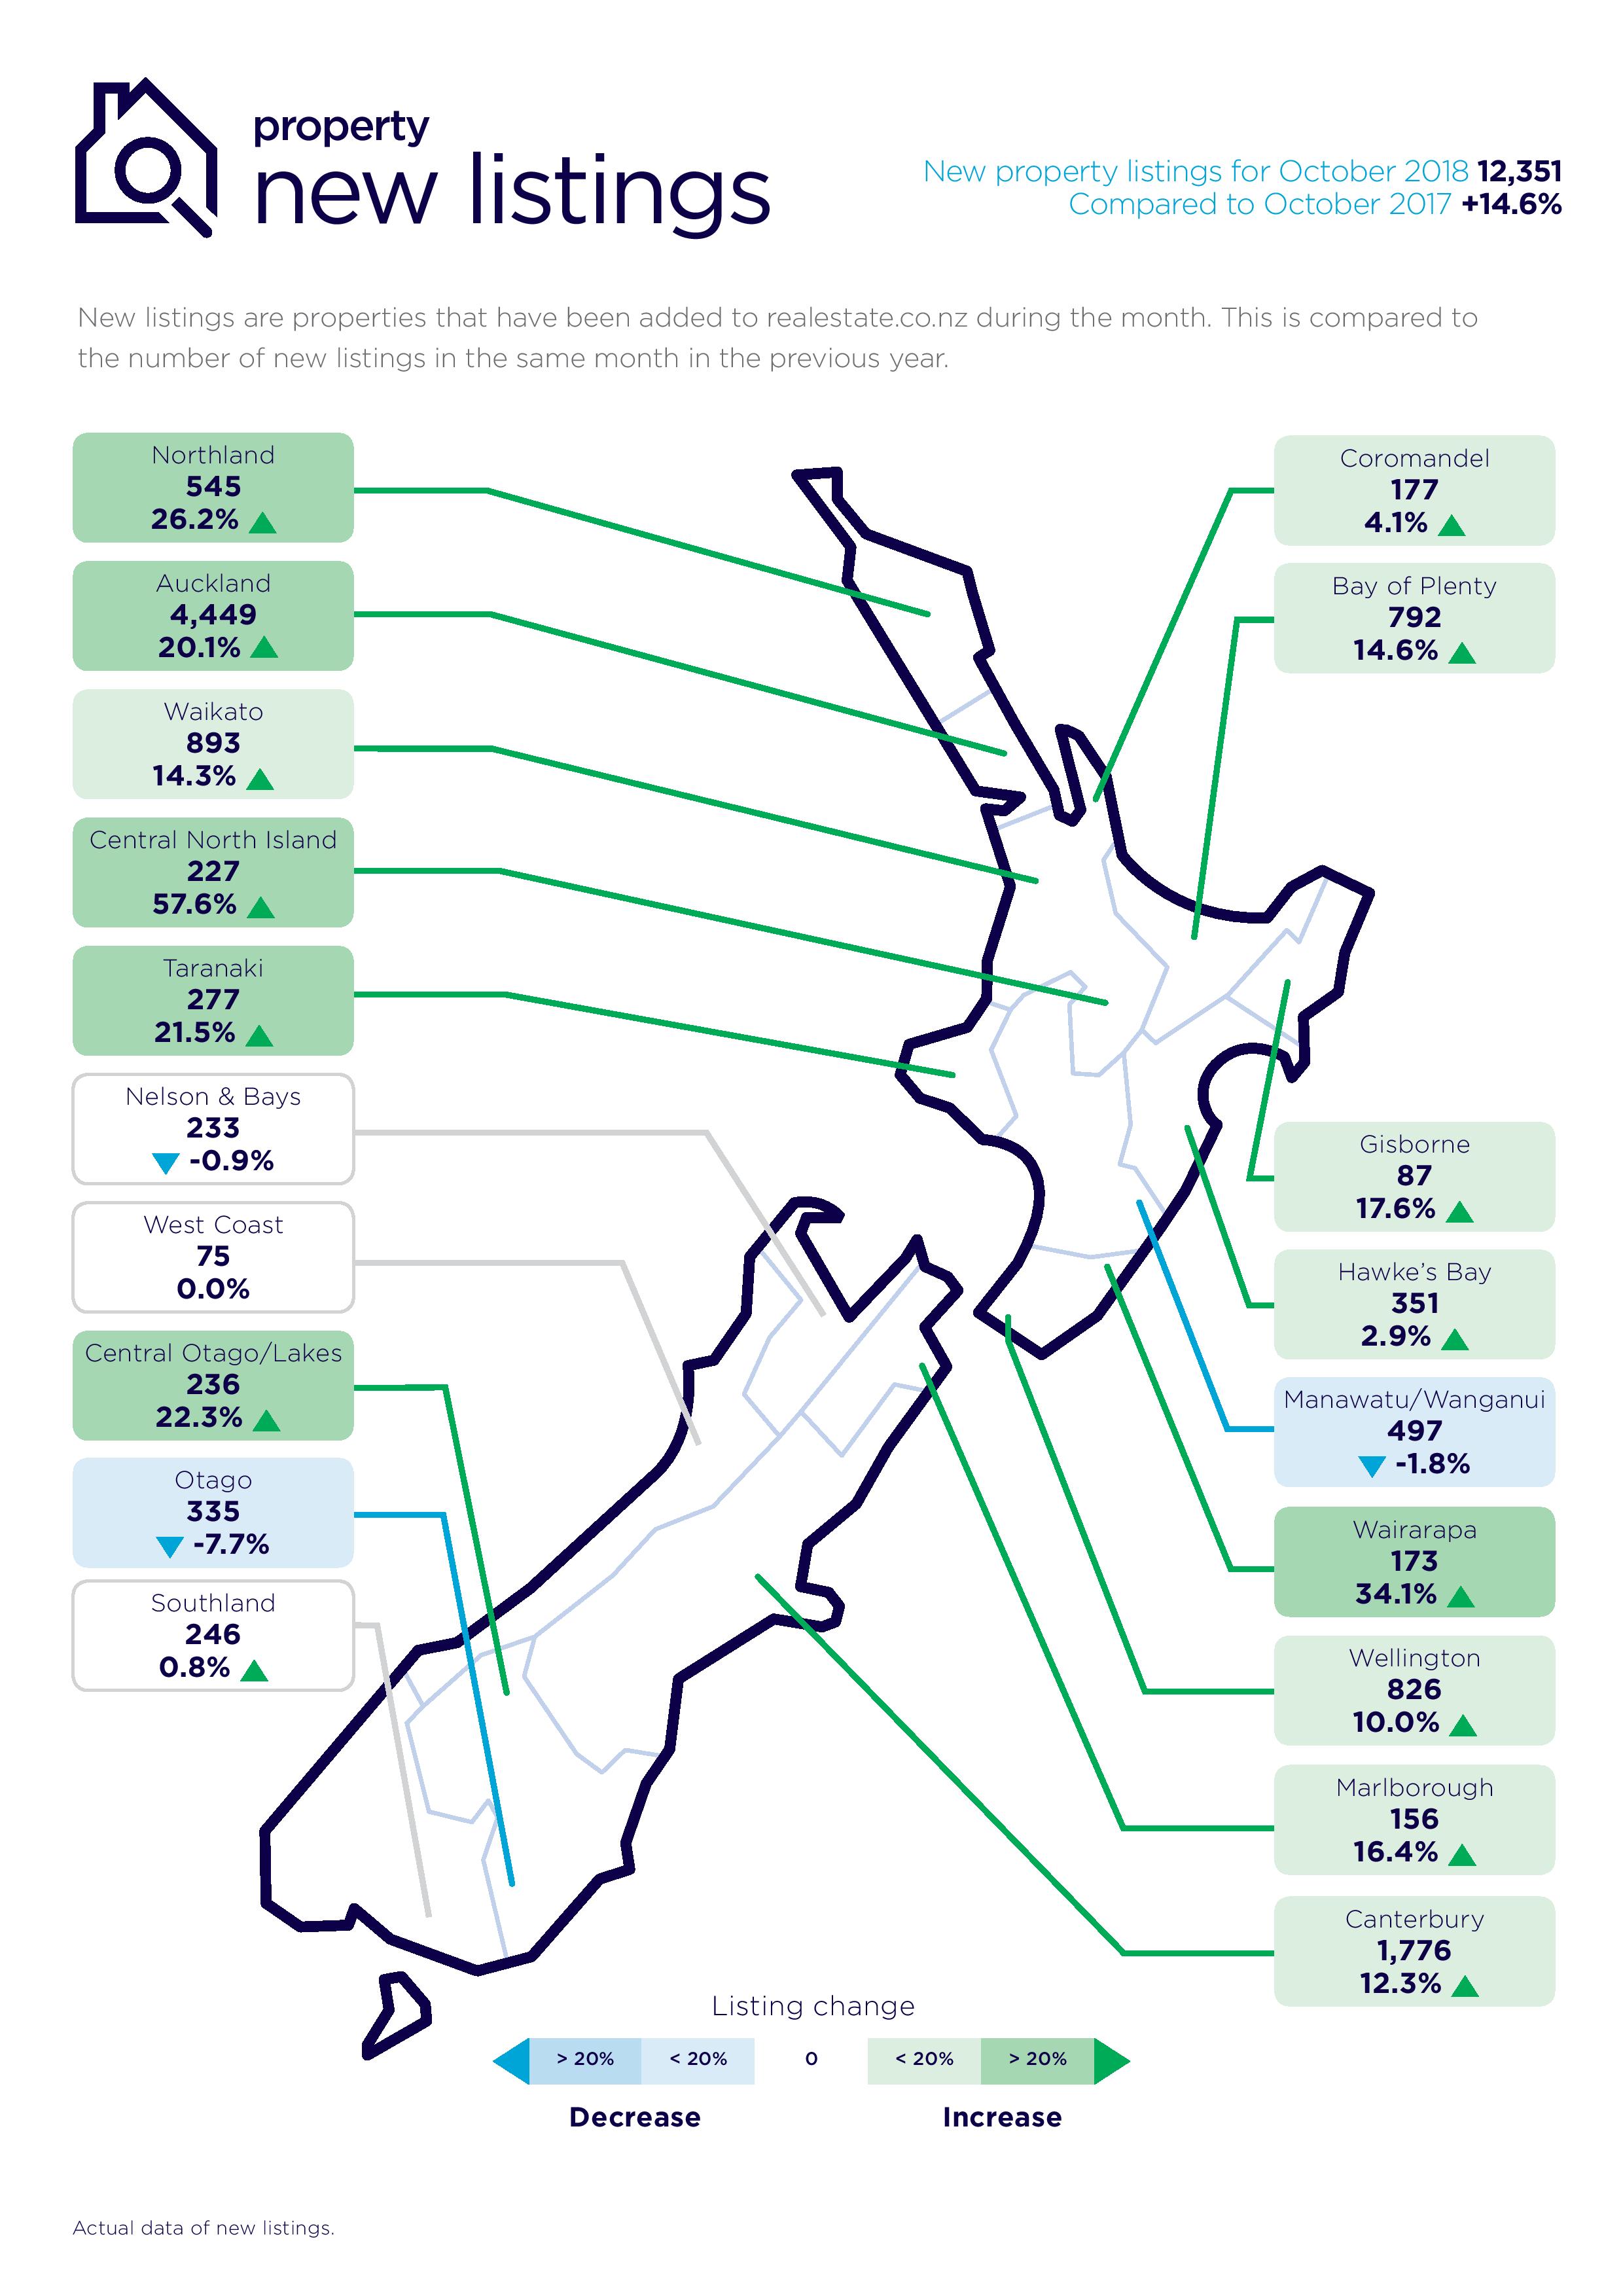
The October figures from Realestate.co.nz show that the number of Auckland homes newly listed for sale on the website in October was up a whopping 20.1% compared to October last year, while the total number of homes available for sale in the region at the end of October was up 17% compared to a year earlier.
However, the average asking price of Auckland homes listed for sale in October was down 1.3% compared to September.
"Given the level of new listings, the total amount of stock for sale and a slowing of sales rates, the Auckland market is favouring buyers to an extent we haven't seen for nearly nine years," Realestate.co.nz spokesperson Vanessa Taylor said.
"It means that buyers have a lot more choice and can take a considered approach to their buying process," she said.
The latest figures from Quotable Value (QV) also point to a softening market in Auckland.
According to QV the average value of all homes in the Auckland region, not just those that sold, was down by 0.3% at the end of October compared to three months earlier.
The biggest drops in average values were in the Gulf Islands where the average value was down 1.9% compared to three months earlier and North Harbour -1.5%.
However, average values were up compared to three months ago in Onewa on the North Shore, and in Waitakere, most of Manukau and Franklin (see the table below for the full district breakdown of value changes).
"Undoubtedly, the heat has been taken out of the market in recent months," QV General Manager David Nagel said.
"A key market indicator, the median days to sell, is up across many regions including Auckland.
"The Super City [Auckland] in particular is seeing vendors' sales price expectations being challenged.
"However in many cases, sellers are refusing to sell below their expectations which is keeping values either at or slightly below their current levels," Nagel said.
The only other major centre where average values have fallen is Christchurch, where the average value is down 0.3% compared to three months ago, with the biggest fall occurring in the city's central and northern suburbs which were down 0.8%.
"We're seeing vendors' sales price expectations being challenged, however in some cases sellers are refusing to budge and withdrawing their properties from the market when their expectations are not met," QV Christchurch Property Consultant Hamish Collins said.
"Typically, sales are occurring where real estate agents are managing vendor expectations carefully."
Outside of Auckland and Christchurch, values continue to rise in other main centres, with Hamilton's average value up 2.8% in the last three months, Tauranga +1.2%, Wellington Region +2.9% and Dunedin +2.8%.
The charts below show the number of new listings and average values of properties throughout the country in October.
| QV House Price Index - October 2018 | |||
| Territorial authority | Average current value $ | 12 month change% | 3 month change % |
| Auckland region | 1,049,689 | 1.1% | -0.3% |
| Wellington region | 672,701 | 10.2% | 2.9% |
| New Zealand | 681,802 | 5.4% | 1.0% |
| Far North | 418,586 | -0.7% | 2.8% |
| Whangarei | 551,549 | 11.3% | 3.6% |
| Kaipara | 544,364 | 7.8% | 0.8% |
| Auckland - Rodney | 941,102 | 0.8% | -0.6% |
| Rodney - Hibiscus Coast | 920,014 | 0.7% | -0.8% |
| Rodney - North | 963,008 | 0.9% | -0.4% |
| Auckland - North Shore | 1,217,762 | 1.4% | -0.5% |
| North Shore - Coastal | 1,394,276 | 2.3% | -0.4% |
| North Shore - Onewa | 975,547 | -0.6% | 0.3% |
| North Shore - North Harbour | 1,184,756 | 1.4% | -1.5% |
| Auckland - Waitakere | 828,326 | 1.2% | 0.5% |
| Auckland - City | 1,238,448 | 1.2% | -0.6% |
| Auckland City - Central | 1,087,510 | 0.7% | 0.5% |
| Auckland_City - East | 1,560,581 | 1.7% | -0.8% |
| Auckland City - South | 1,097,597 | 0.6% | -0.9% |
| Auckland City - Islands | 1,146,730 | 2.9% | -1.9% |
| Auckland - Manukau | 903,386 | 1.1% | 0.4% |
| Manukau - East | 1,157,941 | 0.6% | 0.6% |
| Manukau - Central | 703,942 | 2.0% | 0.8% |
| Manukau - North West | 777,828 | 1.8% | -0.3% |
| Auckland - Papakura | 700,919 | 2.4% | -0.6% |
| Auckland - Franklin | 670,991 | 0.8% | 0.9% |
| Thames Coromandel | 740,448 | 1.0% | 0.3% |
| Hauraki | 404,218 | 4.9% | -2.1% |
| Waikato | 488,001 | 6.7% | 3.3% |
| Matamata Piako | 454,421 | 6.1% | 1.5% |
| Hamilton | 573,757 | 5.7% | 2.8% |
| Hamilton - North East | 726,744 | 5.5% | 2.5% |
| Hamilton - Central & North West | 529,160 | 6.1% | 3.2% |
| Hamilton - South East | 517,465 | 4.9% | 1.0% |
| Hamilton - South West | 513,355 | 6.1% | 5.0% |
| Waipa | 559,661 | 4.7% | 1.1% |
| Otorohanga | 275,687 | -9.4% | 0.9% |
| South Waikato | 243,871 | 14.7% | 17.9% |
| Waitomo | 218,020 | 11.0% | -4.9% |
| Taupo | 483,824 | 8.2% | 1.1% |
| Western BOP | 633,158 | 0.9% | 0.4% |
| Tauranga | 709,746 | 3.3% | 1.2% |
| Rotorua | 434,253 | 7.4% | 1.1% |
| Whakatane | 456,758 | 11.4% | 6.6% |
| Kawerau | 240,003 | 26.7% | 18.7% |
| Opotiki | N/A | N/A | N/A |
| Gisborne | 322,480 | 9.8% | 3.0% |
| Wairoa | N/A | N/A | N/A |
| Hastings | 465,161 | 6.6% | 1.9% |
| Napier | 515,304 | 10.3% | 0.2% |
| Central Hawkes Bay | 340,811 | 19.7% | -5.4% |
| New Plymouth | 452,640 | 5.3% | 1.3% |
| Stratford | 256,394 | -0.5% | -5.6% |
| South Taranaki | 226,697 | 7.7% | 2.2% |
| Ruapehu | 196,562 | 13.9% | 1.8% |
| Whanganui | 268,149 | 17.5% | 6.0% |
| Rangitikei | 230,431 | 23.4% | 11.2% |
| Manawatu | 352,505 | 10.1% | 3.5% |
| Palmerston North | 412,934 | 11.6% | 4.5% |
| Tararua | 212,405 | 17.0% | 3.1% |
| Horowhenua | 325,144 | 12.1% | 2.5% |
| Kapiti Coast | 565,168 | 7.1% | 0.6% |
| Porirua | 571,435 | 8.3% | 2.4% |
| Upper Hutt | 494,165 | 6.2% | 0.9% |
| Hutt | 539,025 | 3.6% | 0.3% |
| Wellington | 809,739 | 9.6% | 3.9% |
| Wellington - Central & South | 814,123 | 11.7% | 4.4% |
| Wellington - East | 863,305 | 6.8% | 3.7% |
| Wellington - North | 734,146 | 11.6% | 5.2% |
| Wellington - West | 916,487 | 6.1% | 1.4% |
| Masterton | 361,178 | 12.6% | 3.0% |
| Carterton | 395,319 | 12.6% | 0.4% |
| South Wairarapa | 488,979 | 9.3% | 2.4% |
| Tasman | 586,219 | 7.2% | 1.0% |
| Nelson | 593,947 | 7.7% | 1.7% |
| Marlborough | 467,537 | 6.8% | 0.3% |
| Kaikoura | N/A | N/A | N/A |
| Buller | 192,645 | 3.7% | 4.2% |
| Grey | 217,228 | 8.4% | 1.1% |
| Westland | 252,719 | 2.3% | 5.4% |
| Hurunui | 385,776 | 1.6% | 0.8% |
| Waimakariri | 444,608 | 1.5% | 1.4% |
| Christchurch | 494,082 | 0.7% | -0.3% |
| Christchurch - East | 374,200 | 1.2% | 0.2% |
| Christchurch - Hills | 671,432 | 3.5% | -0.1% |
| Christchurch - Central & North | 579,908 | 0.2% | -0.8% |
| Christchurch - Southwest | 471,613 | 0.4% | -0.1% |
| Christchurch - Banks Peninsula | 511,660 | -0.8% | -0.2% |
| Selwyn | 553,485 | 1.8% | 0.4% |
| Ashburton | 355,281 | 2.7% | 1.4% |
| Timaru | 361,129 | 2.3% | 0.7% |
| MacKenzie | 524,333 | 8.1% | 4.1% |
| Waimate | 239,769 | 7.2% | -2.2% |
| Waitaki | 303,366 | 6.7% | -0.3% |
| Central Otago | 514,453 | 9.5% | 3.8% |
| Queenstown Lakes | 1,180,082 | 8.0% | 1.1% |
| Dunedin | 422,674 | 10.5% | 2.8% |
| Dunedin - Central & North | 441,553 | 11.0% | 2.5% |
| Dunedin - Peninsular & Coastal | 385,681 | 10.8% | 3.2% |
| Dunedin - South | 403,460 | 10.3% | 3.9% |
| Dunedin - Taieri | 437,475 | 10.7% | 2.8% |
| Clutha | 222,978 | 10.8% | 7.1% |
| Southland | 278,927 | 7.6% | -0.2% |
| Gore | 228,874 | 5.4% | 4.9% |
| Invercargill | 280,275 | 13.1% | 4.9% |
| Main Urban Areas | 793,583 | 4.5% | 0.9% |
We welcome your comments below. If you are not already registered, please register to comment
Remember we welcome robust, respectful and insightful debate. We don't welcome abusive or defamatory comments and will de-register those repeatedly making such comments. Our current comment policy is here.