
By Kevin Trenberth*
El Niño is officially here, according to the US National Oceanic and Atmospheric Administration, and with it comes a change from the La Niña weather patterns New Zealand has experienced for the past three years.
In particular, a switch from prevailing northeasterlies to southwesterlies means New Zealand is one of the few countries where cooler conditions are felt during El Niño. But what “flavour” will this El Niño be?
Time will tell, but El Niño has been looming for some time. Evidence of its imminent arrival could be seen last year in subsurface ocean temperatures, with a buildup of warm water in the Coral Sea and western tropical Pacific.
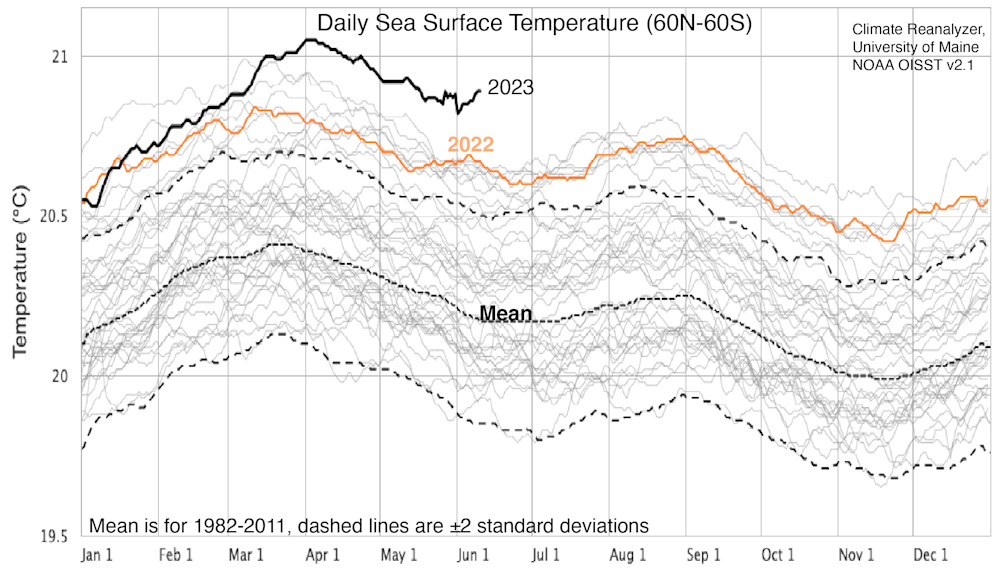
Moreover, it was overdue. When La Niña finally gave up the ghost in March this year, global sea surface temperatures were suddenly the highest on record (Figure 1 below), as the tropical Pacific abruptly began to warm.
Meanwhile, record high sea surface temperatures in the extratropical North and South Pacific were partly a signature from La Niña and partly a sign of global warming. The resulting “atmospheric rivers” delivered torrential rains to California in the north and New Zealand in the south.
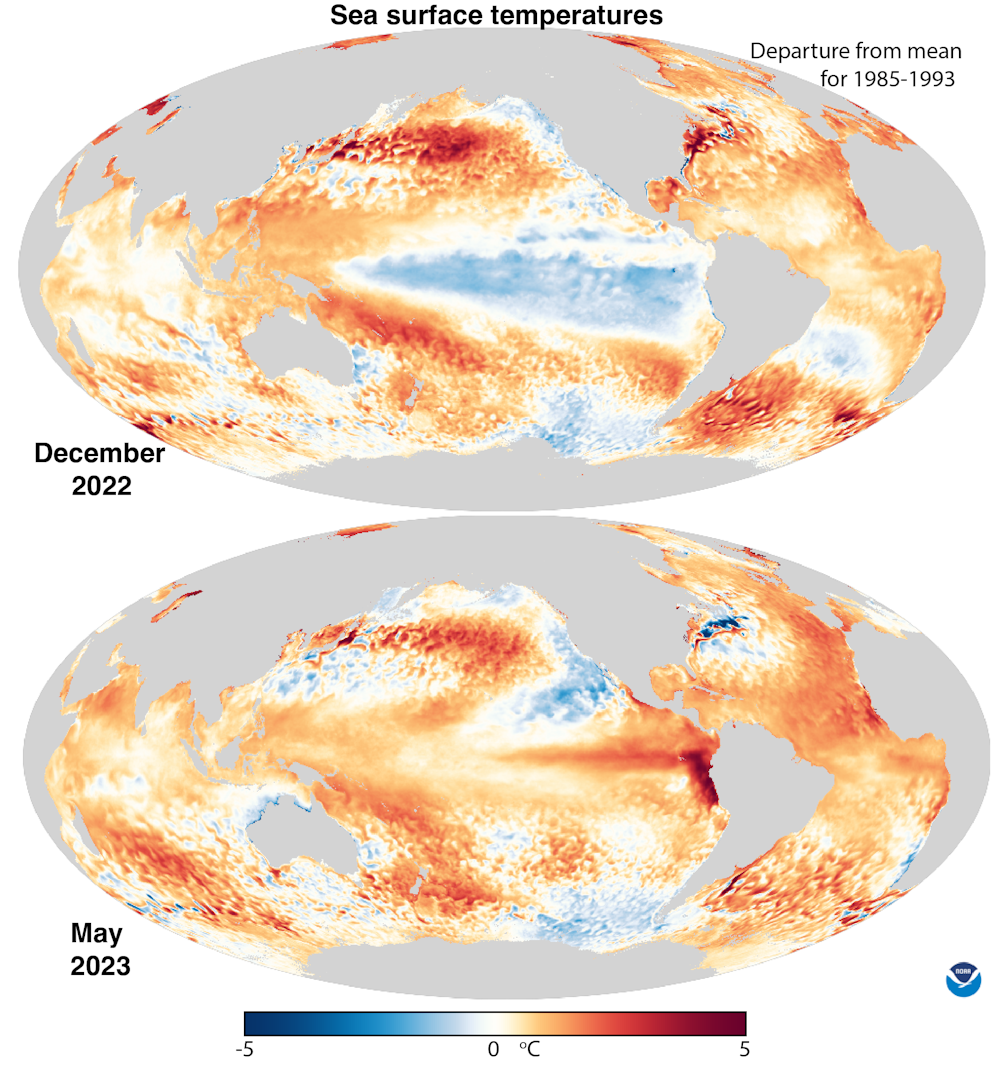
These sea surface temperature changes can be readily seen by comparing variations from mean temperatures for December 2022 versus May 2023 (Figure 2 below). We can see a startling transformation throughout the central tropical Pacific, with a coastal El Niño off Peru and Ecuador strongly evident.
Modest cooling in the eastern North Pacific is associated with the train of storms that barrelled into the West Coast of the US and in northwest Australia from Cyclone Ilsa.
El Niño and New Zealand
The weather in the tropics is seldom average, however. It tends to fluctuate more like a roller coaster. In the atmosphere, this is referred to as the Southern Oscillation. The combined atmosphere and ocean phenomenon is often referred to as the El Niño-Southern Oscillation (ENSO).
The bottom of the roller coaster is the cold phase: a basin-wide cooling of the tropical Pacific, named La Niña, while the top of the roller coaster is El Niño, which occurs every three to seven years or so. The most intense phase of each event typically lasts half a year.
But El Niños can be very strong, and hence highly anomalous. La Niñas, by comparison, are usually moderate in strength and occur more often.
El Niños tend to peak in December, although their biggest atmospheric impacts may not be until February. The last major El Niño was in 2016-17, while a weak El Niño occurred in 2019-20.
Coupled oceans and atmosphere
In the tropical Pacific Ocean, the atmosphere and ocean are strongly coupled. Surface winds drive surface ocean currents, and largely determine the sea surface temperature distribution, the differential sea levels, and the heat content of the upper ocean. In turn, the sea surface temperatures determine the winds.
Cool waters limit atmospheric convection and storm activity, while high sea surface temperatures attract convection, clusters of thunderstorms, and tropical cyclones (off the equator, where Earth’s rotation comes into play).
Heat that was stored up in the tropical western Pacific during La Niña is moved around and into the atmosphere during El Niño, mainly through evaporation. This cools the ocean and moistens the atmosphere.
This alters where the main rainfall occurs. In turn, it changes the latent heating of the atmosphere that sets up “teleconnections” (links between weather phenomena in different parts of the globe) and major changes in the jet streams and extratropical storm tracks in both hemispheres – including across New Zealand, especially in winter.
Because most action occurs over the tropical Pacific Ocean, more settled weather and dry spells often occur over land.
The warmest years in terms of global mean surface temperature are the latter stages of El Niño events. 2016 is the world’s warmest year on record, in part because of the very strong El Niño event. But 2023 could beat that record – and odds are that 2024 will beat it by a lot.
So far, there is little evidence that climate change has altered ENSO events themselves. But all impacts of El Niño are exacerbated by global warming, including extremes of the hydrological cycle involving floods and droughts, which are already common with ENSO.
Impacts of El Niño
Of course, major events related to El Niño have serious social and economic impacts, too. Droughts, floods, heatwaves and other changes can severely disrupt agriculture, fisheries, health, energy demand and air quality (mainly from wildfires).
Research shows El Niño “persistently reduces country-level economic growth”, with damage now estimated in the trillions of US dollars.
Globally, El Niño is the largest cause of droughts; they are more intense, set in quicker and increase the risk of wildfires, especially in Australia, Indonesia and Brazil. In the weak 2019-20 El Niño, smoke from fires in eastern Australia affected the southern hemisphere to the extent that it blocked the sun and may have exacerbated the subsequent La Niña conditions.
Meanwhile, torrential rains are heavier, with greater risk of flooding, especially in Peru and Ecuador. Very wet conditions can also (though not always) occur in California and the southeast US.
Another ‘super’ El Niño?
New Zealand had its highest annual mean surface temperature on record in 2022. In the past year the preponderance of northeasterlies due to La Niña has seen an unprecedented number of tropical and subtropical storms bombarding the country.
The record rain event in Auckland on January 27, and Cyclone Gabrielle just three weeks later, were just two among many such events.
By contrast, New Zealand tends to experience stronger and more frequent winds from the southwest in winter and from the west in summer during El Niño. This can encourage dryness in eastern areas and more rain on the West Coast, with generally cooler conditions overall.
But El Niño varies, and there have been three “super” El Niños: 1982-83, 1997-98 and 2015-16. It remains to be seen whether the latest will join them. But together with the augmenting effects of global warming, any El Niño can be very disruptive. We need to be vigilant.![]()
*Kevin Trenberth, Distinguished Scholar, NCAR; Affiliated Faculty, University of Auckland
This article is republished from The Conversation under a Creative Commons license. Read the original article.
21 Comments
I cannot believe that the entire Western Media is mutated on Japanese testing its equipment to discharge nuclear waste water into the Pacific Ocean and pollute the entire sea water on the earth.
All Pacific island nations have expressing sever concerns but I have heard even a beep from either the AUS or NZ.
Here, being hypocritical about fighting 'climate change'.
WTF?
They are testing with fresh water atm. But radioactive water isn't an actual problem at the low levels which are being released.
very tired of this lipstick on pig argument.
if nuclear polluted water were harmless, it should be discharged in the water ways in Japan.
The power plant is on the coast, the sea is the closest body of water. I guess they could, at great expense, pump the water inland and into a river. At which point, it would promptly flow back out to sea...
Arguments about radiation are much more nuanced than you seem to recognise. Radiation is all around us, all the time. Having a zero risk threshold here means never eating a banana, never drinking coffee, not having a granite worktop and never flying, amongst other things. Show us some numbers and then we can have a real conversation.
Of the tens of thousands who died from the earthquake and tsunami, there is just one case who likely died from radiation (a worker on the plant who developed lung cancer)
Of the tens of thousands who died from the earthquake and tsunami, there is just one case who likely died from radiation
Thus far
All I can picture is the 3-eyed fish off of the Simpsons outside the nuclear plant
Its OK, it'll only wash up in China.
OMG - the author mentioned global warming *and* cooling in the same article! How can this be? (head exploding emoji)
Could it be the difference between climate and weather?
/s
I just wanted to say that I really enjoyed this article, keep up the good work. I imagine bushfires will be bad in Australia next year just owing to having several wet years.
And more years than that since farmers have been able to undertake controlled burns to clean out the rubbish under the bush that ends up creating the massive bush fires.
Indeed. The heating of the Australian climate means the window for safe burns has reduced dramatically.
“The windows for hazard reduction are much shorter now, because the hot weather starts earlier."
https://www.theguardian.com/environment/2023/jun/10/australia-firefight…
Compared to what? If you wanted a big fire you needed to be around 4000 years ago. I hope the Aborigines were in the ETS back then.
"The Marura palaeofire record comprises three main phases: 4600–2800 cal BP, 2800–900 cal BP and 900 cal BP to present. Highest fire incidence occurs at ~4600–4000 cal BP, coinciding with regional records of high effective precipitation, and all fire proxies decline from that time to the present."
https://journals.sagepub.com/doi/full/10.1177/0959683620988030
Great to see real science, unadulterated, unwoked and un-vested-interested.
Thank you.
Yep a very good article.
Agreed. Fact comes without emotion
Trenberth would have to be one of the most politically motivated activists out there. His true colours were exposed in the climategate data dump. He predicted super hurricanes in the future 20 years ago - the future is here and his predicted super hurricanes never arrived and in fact hurricane activity and size dropped as atmospheric CO2 increased the opposite of what he predicted.
https://agupubs.onlinelibrary.wiley.com/doi/full/10.1029/2021GL095774
https://www.nature.com/articles/s41558-022-01388-4
https://www.scientificamerican.com/article/warmer-oceans-stronger-hurri…
Still dragging out that tired "conspiracy" meme profile? That's really dull.
Activist makes an unsupported prediction about "super" hurricanes, and fails, is a conspiracy?*
* this comment was funded by big oil
Finally a warm, dry summer after the past three wet summers.
A long read, but a fascinating one, if this topic is of interest to you
https://theethicalskeptic.com/2020/02/16/the-climate-change-alternative-we-ignore-to-our-peril/
Oh FFS. Can you not see where and why that went where it did.
Note my comment above.
Sigh.
We welcome your comments below. If you are not already registered, please register to comment
Remember we welcome robust, respectful and insightful debate. We don't welcome abusive or defamatory comments and will de-register those repeatedly making such comments. Our current comment policy is here.