
Where do people in Auckland want to live? Land values hold the answer. To better understand the demand for housing across locations, the Chief Economist Unit has developed a spatial model to analyse land values and uncover what drives them.
What do we mean by demand?
In this context, demand refers to the price people are willing to pay for land for housing, given its location, local characteristics and development potential.
People’s housing preferences vary. Some prefer more space and live further out, travelling to access what they need. Others forgo space to be closer to jobs, transport, or amenities like shops, schools, and parks. In general, people optimise their location by trading off what they want against what they can afford.
Higher land values indicate stronger demand, as people are willing to pay more for land in those areas. This doesn’t imply that other locations are not valued by those who live there – it simply reflects that the strength of demand varies across Auckland.
A new spatial demand model
Using 2024 property valuations, the model estimates land values per square metre to assess how location influences demand. It covers land zoned residential or business mixed use. Regression analysis identifies factors affecting land values. To isolate demand for location, the model adjusts for two key factors.
- Zoning policy — the value of land is partly driven by its development potential, with land zoned for more intensive use generally having higher value. The model controls for how zoning varies across locations to separate out this effect.
- Local characteristics —differences in land value due to neighbourhood-level factors, such as the built form, are controlled for at the meshblock level (small geographic units).
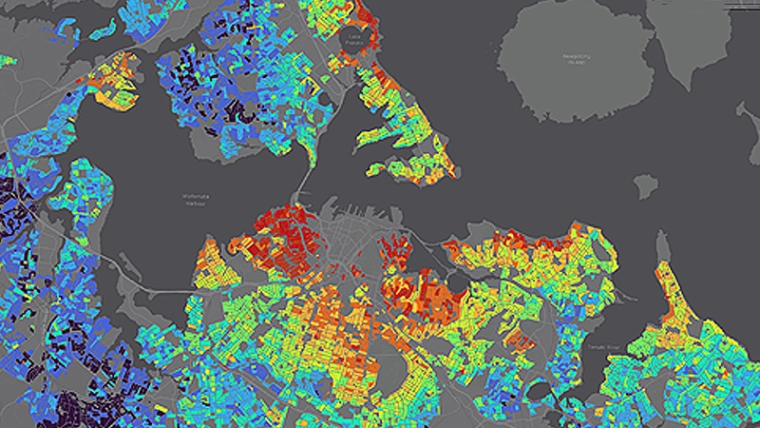
A picture of location-driven demand
Mapping the model’s estimated land values reveals how demand for location varies across Auckland. Figure 1 presents this spatial pattern as a heat map.
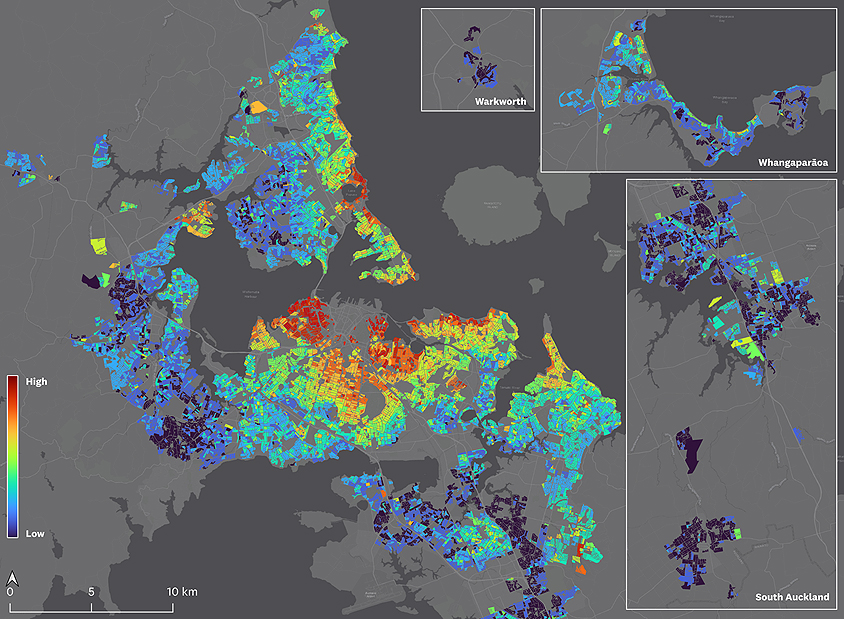
Note: Includes land zoned Single House, Mixed Housing Suburban, Mixed Housing Urban, Terrace Housing and Apartment Buildings, and Business – Mixed Use. Source: Auckland Council Chief Economist Unit
Demand tends to be higher in more central locations, reflecting their proximity to jobs, transport, and urban amenities. Demand is often higher in coastal areas too, reflecting the appeal of their natural amenity. In general, the closer a location is to these features, the higher the land value.
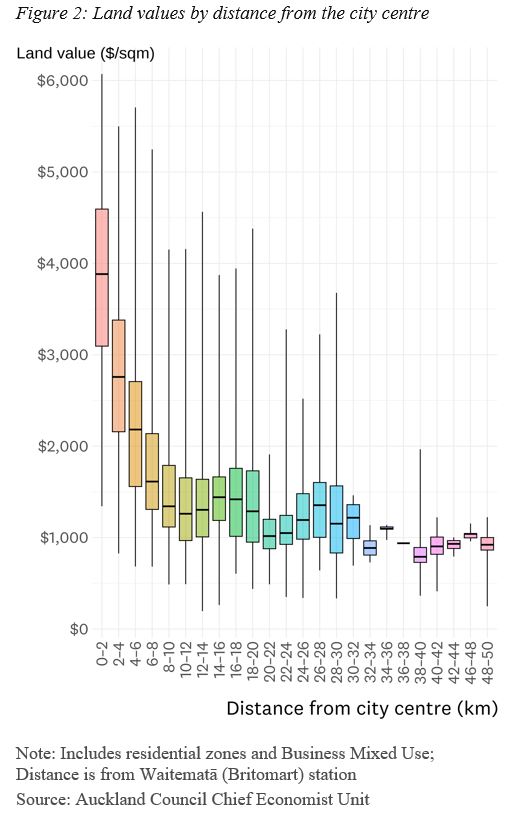
Another way to visualise demand is to plot land values by distance from the city centre. Figure 2 shows a box and whisker plot with 2km bands: the box show the middle 50% of values, the line marks the median, and the whiskers indicate the range. Land values tend to decline with distance – a common urban pattern – but with some variation at each distance that reflects the influence of other centres and natural amenities.
While Auckland has a network of centres offering jobs and services, the data suggests it is more monocentric (a dominant city centre in a hierarchy of centres) than polycentric (multiple centres, none dominant).
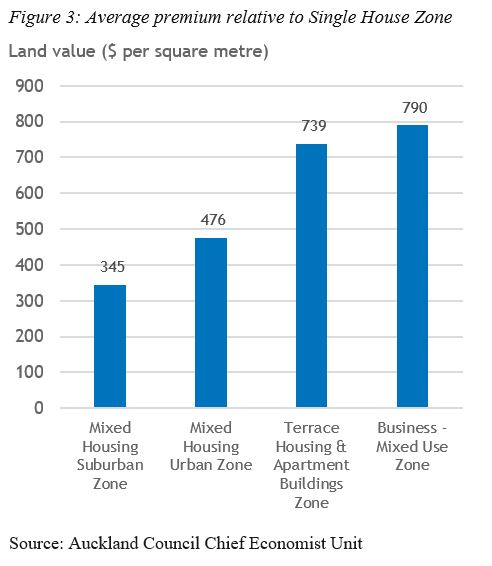
Zoning and land value
Zoning policy influences land values. Land zoned for more intensive development tends to have higher value, reflecting its potential for more productive use and the option to use less land per home. Figure 3 shows how, on average, land values rise with enabled development intensity relative to the Single House Zone. This finding aligns with research showing that upzoning under the Auckland Unitary Plan increased the redevelopment premium for properties, with the effect depending on the extent of zoning change and existing development intensity.[1]
Policy implications
Land values show demand for housing is higher near things people want to access. Enabling higher density makes land more valuable, reflecting its potential for redevelopment. This means zoning influences how and where housing supply can respond to demand.
These insights help us understand the government’s direction to Auckland Council to enable more density, such as heights of 10-15 storeys around some stations on the Western Line. Adding capacity for development in higher-demand locations improves commercial feasibility as developers can have more confidence in buyer interest. This approach also makes better use of existing infrastructure and services, while offering people choice to live closer to what they need.
[1] Greenaway-McGrevy, R., Pacheco, G., & Sorensen, K. (2021). “The effect of upzoning on house prices and redevelopment premiums in Auckland, New Zealand”, Urban Studies, 58(5).
* Gary Blick is the Chief Economist at Auckland Council. This article is here with permission. The original is here.
6 Comments
The Catholic church in Auckland is also currently restructuring some parishes. They currently have over 70 parishes . Not enough priests. Average age of some parishes is very high and not enough people. Other parishes are much younger and overflowing. Also they have a massive and expensive to maintain property portfolio. Will be interesting to see the result but chances are the red and yellow parts of the map won't like it .
The Council needs to do the same hard thinking. Most of the best playgrounds and libraries are in the places with the fewest kids. People drive across town to get to the good parks, playgrounds and pools. Investment should follow population and growth and not go to the museum suburbs that want to lock in their heritage and "way of life".
This only tells half the story, and not a very good one for when it comes to setting land use policy.
Yes, almost without exception very city in the world looks like Figure 2, eg Auckland, Sydney, San Francisco, Houston all have this curve from higher prices in the CBD and lower to the fringe.
But the price of all housing, of all types and all locations on that curve is about half the price, on a median income multiple, in Houston as it is in the other cities.
And that is because Houston has less restrictive land use polices that allow both up and out, where the others have more restrictive land use policies that favour up at the expense of out.
In Summary, The Demographia Report 2025 Page figure 11 shows this effect.
Demographia International Housing Affordability, 2025 Edition
Thus the 30% to 50% of what you pay for a house anywhere in Auckland has nothing to do with what the analysis in this article shows.
Further, when housing is more affordable based on your income, you have a greater choice of what you can buy across a wider range of housing types, just like a person who has $5,000,000 can choose from lifestyle blocks to large inner-city apartments compared to someone who only has $750,000 to spend.
This means there is less demand for smaller density just because that is all you can afford. This results in developers NOT paying anymore for a property just because it can fit more housing per se. In fact, the high density land is discounted back by the fact that higher density house costs more a a$m2 basis than a free-standing house and the higher cost, to a point, is a discount against the land value.
Not just added onto the price and/or results in smaller and smaller dwellings as it does under a restrictive land use model like Auckland.
Your indepth knowledge of Houston Texas' better land policies are wasted here. Have you or will you share your ideas with Wellington?
If need be, do more research via AI, write a paper or submission or have direct correspondence with C Bishop office. There was the Going for Housing Growth policy statement and the Highly Productive Land changes out for discussion recently. I'm sure you could find a suitable avenue.
Is Houston the best example, what other cities have innovative planning
Yes, I have had direct contact with a number of Ministers, past and present, and many of the present policies show a reflection of that.
However, the biggest problem is NZ GDP is so tied to the speculative property market, and it will take some time to find a value added alternative, that there will be some economic pain in the interim.
I still know that many of their policies are being blocked by the old status quo bureaucracy.
Even some decisions from the fast track panel are counter to the policies they are meant to promote as the panel themselves don't seem to understand the plan.
I think it is about doing as much as you can do, without losing the votes of those supporters whose vested interests in maintaining property speculation you are going to negatively affect, so you can get re-elected to finish the job.
Great graph, thank you.
So people want to live near the city, the water, and the central schools. No surprises...
Cool visual modeling all the same.
We welcome your comments below. If you are not already registered, please register to comment
Remember we welcome robust, respectful and insightful debate. We don't welcome abusive or defamatory comments and will de-register those repeatedly making such comments. Our current comment policy is here.