

By Martien Lubberink*
Some weeks ago, the Reserve Bank of New Zealand (RBNZ) published its consultation on bank capital with submissions closing on 3 October. That’s by the end of this week!
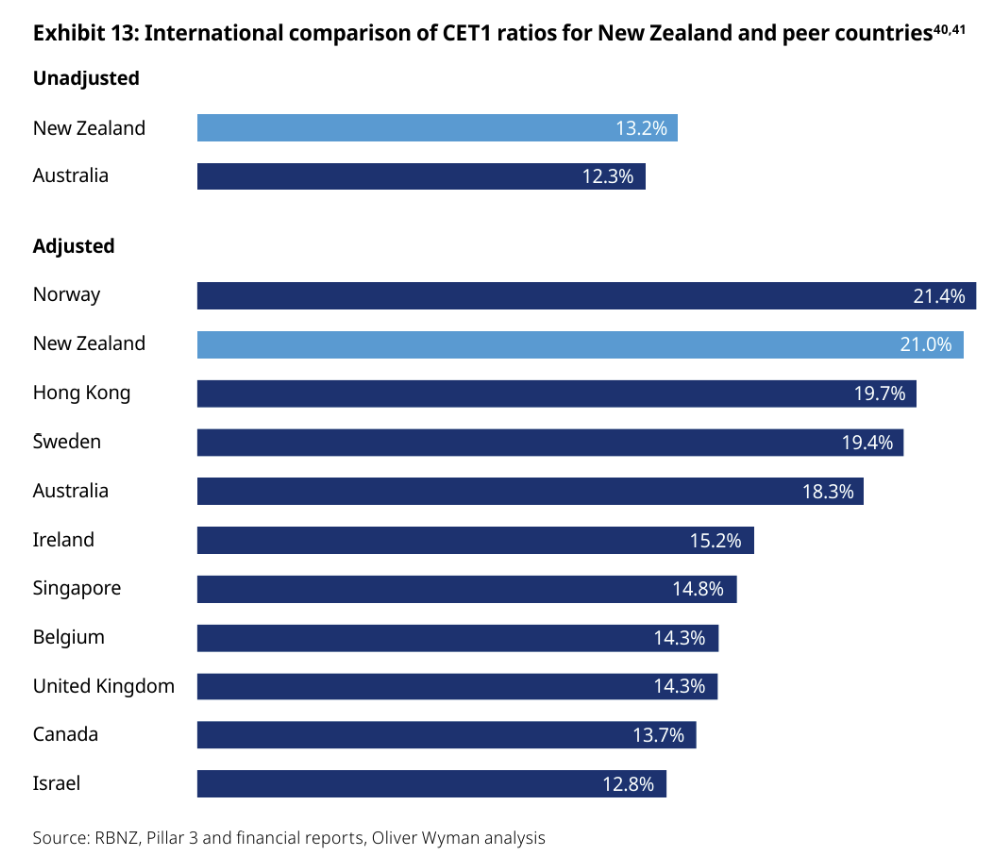
To support its proposals, the RBNZ commissioned Oliver Wyman to benchmark New Zealand banks’ capital ratios against international peers. Central to their analysis is a report claiming that New Zealand bank capital ratios would be 780 basis points higher if calculated under Basel III international standards. The RBNZ states: “Current CET1 [common equity tier 1] ratios are estimated to be around 780 basis points higher when they are adjusted for these differences.”
This substantial adjustment forms the foundation for arguments that New Zealand banks are overcapitalised relative to international peers.
However, the Oliver Wyman report employs two iffy methodological choices that systematically bias the comparison in favour of finding New Zealand banks overcapitalised: a peculiar selection of comparator countries and a size-adjustment technique that obscures the fundamental relationship between bank size and capital ratios.
The peculiar choice of comparator countries
The RBNZ has adopted a new approach to capital setting based on international comparability – benchmarking against a range of comparator countries. This makes the choice of appropriate comparators crucial. Yet Oliver Wyman’s choices raise questions.
Of the 10 comparator jurisdictions, five are European: Belgium, Ireland, Sweden, Norway, and the United Kingdom.* But from a banking regulatory perspective, Europe effectively functions as a single jurisdiction. Since 2014 European Capital requirements are set through the Capital Requirements Regulation (CRR) and Capital Requirements Directive (CRD), determined through a legislative process involving the European Commission, European Parliament, and Council of the European Union (and not by the European Banking Authority as Oliver Wyman suggests).
By selecting five European countries, Oliver Wyman effectively counts Europe five times in a 10-country sample, biasing the results toward European banks’ typically lower capital ratios. This reinforces the impression that New Zealand is an outlier.
The choice of specific comparators adds to my concerns. Why compare New Zealand to Belgium, Ireland, and the UK – all countries with banks that experienced severe difficulties during the Global Financial Crisis? If we’re benchmarking our regulatory settings, shouldn’t we restrict the comparison to countries that best weathered financial storms: Australia, Canada, Hong Kong, and Singapore? As Calomiris and Haber document in Fragile by Design, these jurisdictions have a solid track record when it comes to financial stability. Why not include Poland or Chile, countries that – like New Zealand – host foreign-owned banks?
Perhaps more concerning, three of the five European countries are Basel Committee members. The Basel Committee sets minimum standards designed to accommodate the bespoke needs of its members – particularly European countries, as I argued earlier this year in my Newsroom comment. This creates a “lowest common denominator” problem: Basel rules are calibrated to ensure no European country is left behind, inevitably making more conservatively capitalised systems like New Zealand appear overcapitalised by comparison.
The figure, from the Oliver Wyman report, shows New Zealand capital ratios are exceptionally high. Below I argue the reality is more nuanced.
The size problem: An old trick with consequences
To get our head around the importance of size, we should first realize our banks are … tiny. We talk about the Big 4 banks as if these banks are really big. They are not. Just to give you a flavour of the size differences between our banks and those that populate the rest of the planet, I lined up 11 of our banks with 109 banks from the European Banking Authority 2024 Transparency Exercise and Oliver Wyman’s sample banks.** The results are revealing:
- Our ANZ is smaller than mid-tier European banks like Monte dei Paschi.
- HSBC is approximately 25 times larger than ANZ, our largest bank.
- Kiwibank, our traditional retail bank, is roughly the same size as fintech newcomer Revolut.
- Total assets of New Zealand’s big four banks combined are about half of those of Rabobank Netherlands alone.
New Zealand banks are tiny on the international stage.
More concerning: every New Zealand bank is smaller than the smallest bank in Oliver Wyman’s sample, based on available data from the RBNZ, LSEG DataStream, and the EBA Transparency exercise. That should give pause.
Small banks hold more capital
The second thing we should realize is this: my sample data shows a clear negative relationship between size and capital ratios: smaller banks report CET1 ratios around 20%, while the largest cluster around 12% to 14%. Société Générale, more than 10 times the size of our largest bank, maintains a CET1 ratio of 13.11%. This negative relationship between bank size and capital ratios is well-established and appears clearly in the data.
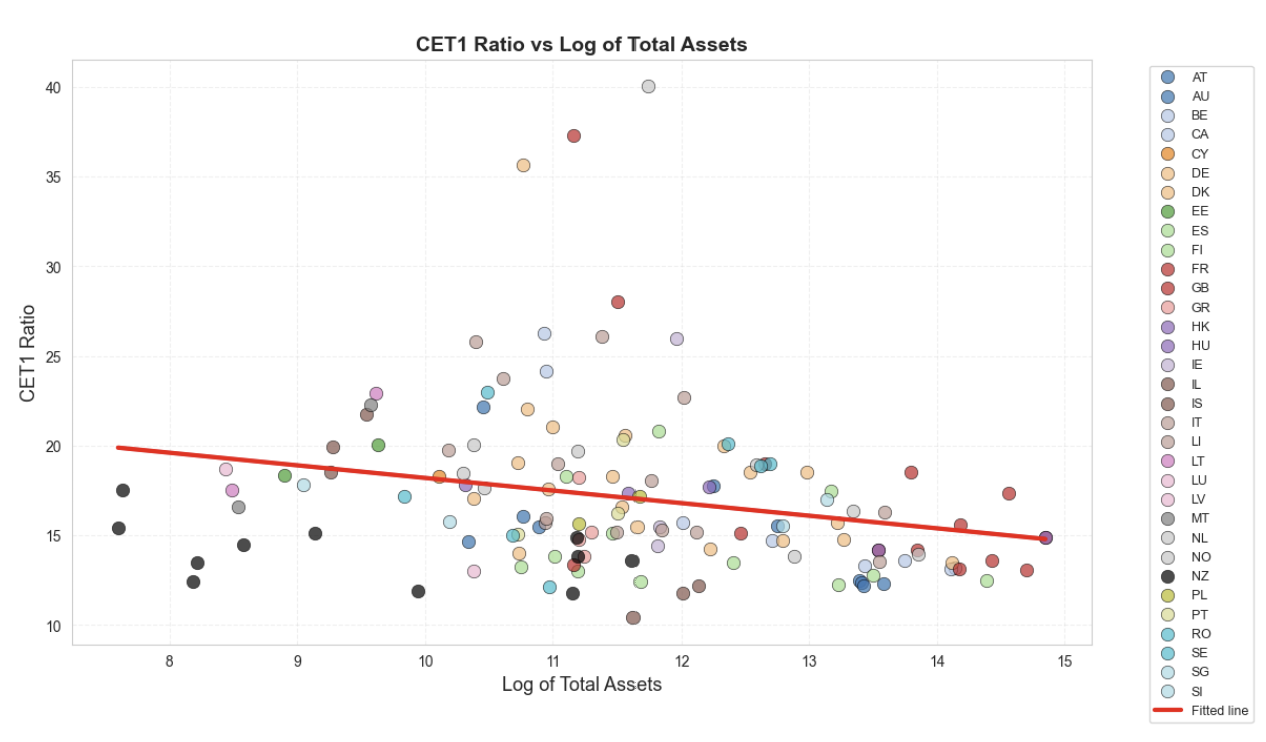
This negative correlation isn’t coincidental. Larger banks benefit from economies of scale, diversification, and implicit government guarantees (too-big-to-fail), allowing them to operate with lower capital buffers. Smaller banks lack these advantages and prudently maintain higher capital ratios. I explained this in earlier posts, e.g. this one here, this one here, and this one here.
The weighted average trick
Given their size, it is natural that New Zealand banks should have higher ratios. The critical question becomes: how do we make valid comparisons between banks of vastly different sizes?
Here Oliver Wyman makes a consequential methodological choice: it calculates weighted averages: basically pooling all capital and risk-weighted assets to produce a single ratio for each country. This effectively treats all banks in a country as one merged mega-bank. The result is heavily influenced by the giants: HSBC, Barclays, Royal Bank of Canada (RBC). These are also the banks with the lowest ratios.
This approach is defensible when calculating a representative capital ratio for an entire country. But given the enormous size differences between comparator banks – which include behemoths like HSBC and Barclays alongside New Zealand’s tiny institutions – this adjustment is … odd.
The weighted average systematically biases results toward large banks, which typically maintain lower capital ratios. This is clearly visible in the first figure: the 13.2% unadjusted CET1 ratio for New Zealand is largely driven by ANZ, even if you include all New Zealand banks in the sample. The 13.7% ratio for Canada is likely driven by RBC.
Another way of framing the size issue: financial crises don’t ‘adjust for size’ the way Oliver Wyman does. The 2023 banking turmoil demonstrated that medium-sized institutions like Silicon Valley Bank can create systemic havoc affecting the entire US financial system. Size-based averaging obscures the reality that smaller banks can destabilise the entire financial system. The issue is correlations: in a crisis, many small banks start behaving as if they were one big bank. Think Hitchcock’s The Birds: a single bird is harmless, but when the flock turns, the effect is terrifying.
What happens when we account for size differently?
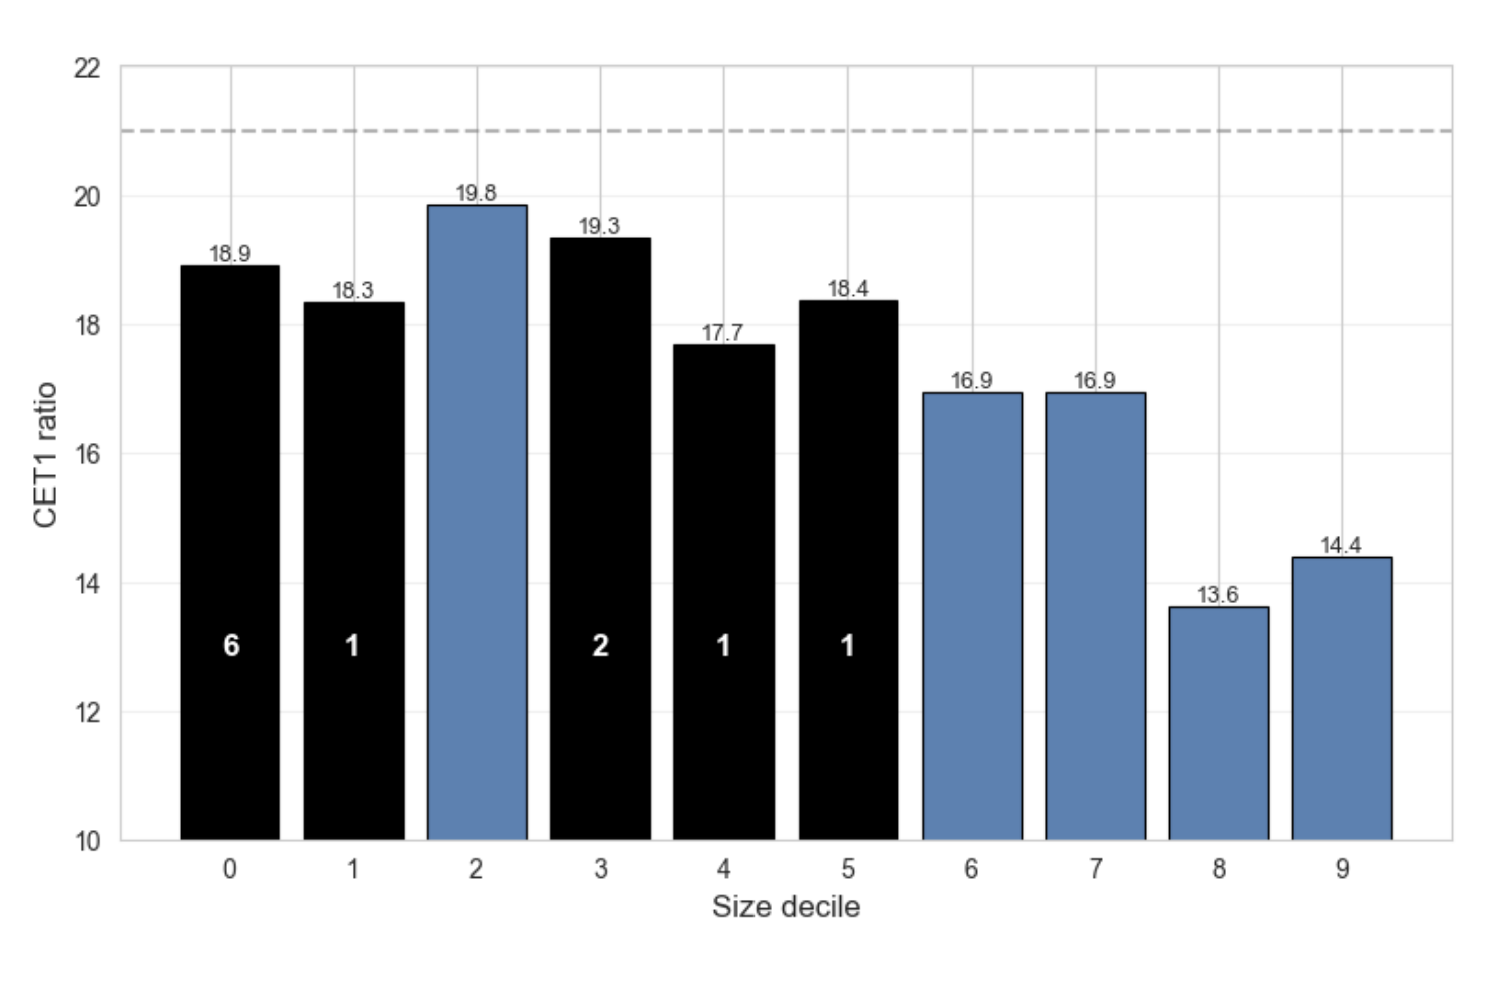
To illustrate the effect of Oliver Wyman’s choice, I sorted my bank sample by total assets and formed 10 size-based groups (deciles). For each group, I calculated the average CET1 ratio excluding the New Zealand banks. The results are revealing: groups which would harbour New Zealand banks (shown as black bars in the attached chart, with the corresponding number of NZ banks in white font) feature CET1 ratios around 19%. So, decile 3 has Kutxabank and Banco de Crédito Social Cooperativo and 11 other banks. For banks in that group, the relevant CET1 ratio is 19.3%. Now, based on size, ASB and Westpac would be part of that group. So, for these two banks, 19.3% would be a benchmark capital ratio. Not the 13.6% or the 14.4% of the top deciles.
Now, let’s accept Oliver Wyman’s 780 basis point adjustment and the resulting adjusted CET1 ratio of 21% as a representative capital ratio. This is shown in the first figure of this post: 13.20% +7.80% = 21.0%. I included the 21% as a dashed horizontal line in the figure below.
The bar graph demonstrates that most New Zealand banks have high capital ratios (say 21% if adjusted), but these aren’t far from their true peer group – banks of similar size – rather than the mega-banks dominating Oliver Wyman’s weighted averages.
Why this matters
The way RBNZ presents the Oliver Wyman report creates the impression that New Zealand banks hold 780 basis points more capital than necessary by international standards. This conclusion rests on two tricky methodological choices: counting Europe (yes, Europe!) five times in a 10-country sample and using size-adjustment techniques that compare our small banks to global giants.
When we account for bank size differently and select size-based peers, the picture changes significantly. New Zealand banks’ capital ratios appear much more appropriate for institutions of their scale, rather than excessive outliers requiring correction.
The deadline for submissions is Friday (3 October). This analysis suggests the RBNZ should think long and hard about the foundation on which their proposals rest.
*Australia, Canada, Hong Kong, Singapore, Israel, the UK, Belgium, Sweden, Ireland, and Norway. Inadvertently, Oliver Wyman included a bank from Finland, but yeah, that would be nitpicking.
** My sample has 11 New Zealand banks: ANZ, BNZ, Westpac, ASB, Kiwibank, Rabobank, Heartland, TSB, SBS, BOC, and Co-op. Oliver Wyman’s NZ sample has ANZ, BNZ, Westpac, ASB, and KiwiBank. My sample counts 109 EBA banks and 20 banks from Oliver Wyman that are not in the EBA sample.
*Martien Lubberink is an Associate Professor in the School of Accounting and Commercial Law at Victoria University. He has worked the the central bank of the Netherlands where he contributed to the development of new regulatory capital standards and regulatory capital disclosure standards for banks worldwide and for banks in Europe (Basel III and CRD IV respectively).
This article first ran here and is used with permission.
7 Comments
So is the RBNZ captured by the lobbying of our banks? If Professor Lubberink can figure the problems out with the report, why can't those who staff the RBNZ? And why would Oliver Wyman produce such a flawed comparison? What were the Terms of Reference for the report, was he constrained in some way?
So is the RBNZ captured by the lobbying of our banks?
It's a fair assumption to make. But that is the whole problem. While most people would assume central banks are working for the people, that's not actually how they work. They also work for the interests of the banks - the game of mates. Arguably they will say that the people's interests and the banks interests are one and the same. But in reality it's difficult to tell at times. Suppressing the cost of credit may be good for the Ponzi, but it's not necessarily good for economic health and younger people. The banks seem to win either way, since they're largely protected from failing.
In the case here, I don't understand why the RBNZ is not approaching this from a 'most conservative' position. That is, holding the flame as close to the banks as possible. But it appears they're not doing that. And that should be of concern.
Excellent article and brings the receipts. Loosening capital requirements in NZ is the easiest and fastest way to give the banks more money to lend. Supply side economics believes that this readily available cash will be snapped up by NZ consumers and business to spend and grow the economy.
That's the theory and prevailing belief driving the desire for change. Data suggests that NZ's private sector is already too highly indebted and is currently paying down debt at the moment.
"New Zealand banks’ capital ratios appear much more appropriate for institutions of their scale, rather than excessive outliers requiring correction."
I suspect Willis's indirect hand in this, lobbied seperately from RBNZ by the big banks. I've had a gut feel about this capital issue being mostly political with the current requirements below what they should be. Now we have an expert in these matters laying it out that the current capital are at best not comparable with selected countries and are OK in NZ, not to be lowered. Add another 10% to their capital requirements and I'll sleep easier at night. Bank capital are something that should err on the conservative side, not be subject to Bank influence.
Orr wanted banks to hold more Capital
That appears to be the only feather in his cap.
It’s pretty wild that people still default to lending their entire paycheck to leveraged property banks. With only ~13% capital, every $100 you deposit means you’re basically trusting that the other $87 will be there when you ask for it back. That feels less like “safe savings” and more like rolling the dice.
I wouldn’t be surprised if more workers who can negotiate real wages start asking to be paid in harder money instead - whether that’s Bitcoin or fully reserved fiat (like USD Tether). Why we keep automatically lending our earnings to banks that lever up on bubbly australian property is beyond me.
We welcome your comments below. If you are not already registered, please register to comment
Remember we welcome robust, respectful and insightful debate. We don't welcome abusive or defamatory comments and will de-register those repeatedly making such comments. Our current comment policy is here.