

By Gareth Vaughan
Average bank funding costs fell to a five-year low in the December quarter of 3.80%, KPMG says in its Financial Institutions Performance Survey for the three months to December 31, 2012.
"Some of the intense competition for deposits has eased over recent quarters, and we see that over the entire sector the cost of funds reduced by six basis points over the quarter to 3.80%, the lowest cost of funds we have seen in the last five years," said KPMG.
"This reflects less competition in the term deposit market, but also the overall improvement in global market conditions which has made raising funds offshore easier and cheaper."
KPMG says the 3.80% rate is basically the average interest rate a bank would be paying for all its funding. In the June 2008 quarter this measure was 8.04%, but a year later it had dropped to 4.53%.
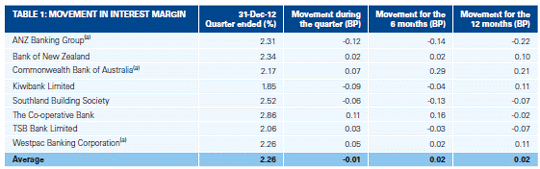
However, despite the drop in funding costs, the average net interest margin for the banks surveyed - ANZ, BNZ, Commonwealth Bank of Australia's New Zealand operations including ASB, Kiwibank, SBS, the Co-operative Bank, SBS and Westpac - fell by 1 basis point to 2.26% quarter-on-quarter. The biggest increase, of 11 basis points, was recorded by the Co-operative Bank, which also recorded the highest net interest margin at 2.86%. ANZ recorded the biggest decline, dropping 12 basis points to 2.31%.
"Net interest income increased due to volume as gross loans and advances increased 0.99% for the quarter but net interest margin was one basis point lower for the December quarter at 2.26% reflecting a strong quarter of asset growth," said KPMG.
In terms of quarterly percentage gross loan growth, CBA/ASB led the way with 2.25%, followed by the Co-operative Bank with 2.06%. For the 2012 calendar year, the Co-operative Bank grew gross loans by 6.45%, Kiwibank by 6.22%, BNZ by 5.55%, CBA/ASB by 4.89%, TSB by 3.64%, ANZ by 3.44%, and Westpac by 2.60%. SBS' gross loans shrank by 7.44% over the year, or by almost NZ$200 million.
Westpac, meanwhile, was the only one of the big four to see its operating expenses to operating income ratio increase in the December quarter, with the average ratio across the eight major retail banks down 4.4% from the previous quarter.
KPMG said the average operating expenses to operating income ratio across the banks surveyed fell to 46.36% in the three months to December 31, from 50.79% in the September quarter. Five banks recorded decreases and three recorded increases.
The largest decrease came from BNZ, which fell to 49.64% from 73.43%. The biggest increase came from Kiwibank, up to 66.37% from 63.16%. Westpac's ratio rose to 43.41% from 40.48%. KPMG noted a drop in operating expenses showed banks' efforts to control costs, and in some cases the completion of IT projects started in the previous year.
"The movement in the BNZ ratio is heavily impacted by fair value movements on financial instruments, which can be volatile quarter on quarter," KPMG said.
ANZ's ratio fell to 46.99% from 53.37%, and CBA-ASB's to 39.40% from 40.00%.
Net profit after tax across the banks surveyed rose 11% to NZ$855 million, again versus the September quarter. KPMG said the increase was mainly driven by an increase in non-interest income, with this boosted by gains in fair value movements, and to a degree, a reversal of movements in the previous quarter. Total assets rose NZ$3.1 billion, or 0.84%, with six banks growing gross loans.
However, KPMG said banks' return on assets continues to be under pressure with "intense" competition for mortgages. A drop of nine basis points in the average return on assets saw this come in at an average of 5.66% across the eight banks. Factors behind the fall included competition in the hot Auckland mortgage market, net migration, and Christchurch rebuilding.
"There is a continuing trend, indicated by data from the Reserve Bank that shows mortgage customers are continuing to switch from floating to fixed (interest rates). This is of no surprise, as banks are offering lower fixed two-year and one-year rates than the floating, and customers are jumping on to these, sensing the time is finally right to move to fixed," said KPMG.
The chart below shows impaired asset expense versus average gross loans and advances at the bigger banks.
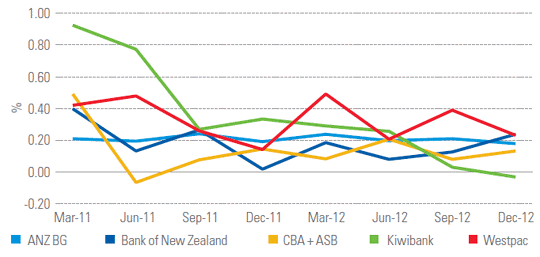
*Both the table and chart above are taken from the KPMG report.
This article was first published in our email for paid subscribers. See here for more details and to subscribe.
We welcome your comments below. If you are not already registered, please register to comment
Remember we welcome robust, respectful and insightful debate. We don't welcome abusive or defamatory comments and will de-register those repeatedly making such comments. Our current comment policy is here.