

The jobless rate dipped slightly in the March 2026 quarter from the December 2025 quarter, going from 5.4% down to 5.3%.
There were 163,000 unemployed people in the March 2026 quarter, compared with 165,000 in the December 2025 quarter, as measured by the Household Labour Force Survey. But that was up from 156,000 in the March 2025 quarter.
There are now 2,889,000 people employed in workforce of 3,052,000. That is of a total working aged population of 4,335,000. So the employment rate was 66.7%, but that was down from 67.1% in the same quarter a year ago.
Basically, under-employment rose.
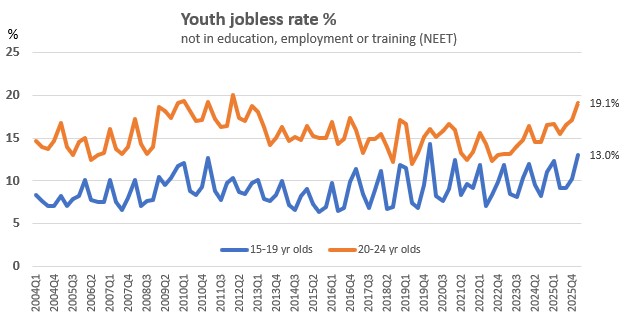
Some of that is due to rising youth unemployment. This is tracked by the NEET rate, measuring the level of those 15-24 who are not in education, employment or training. This rate now stands at 15.9% or 108,600. A year ago it was at 14.4% or 97,400. (These NEET levels are before seasonal adjustment so reflect 'actual' people involved.) For those aged 24-29, this is the highest level since 2013.
| Quarterly change |
Annual change |
|||
| Overall wages (not seasonally adjusted) | Index | Percent | ||
| Wage inflation (salary and wage rates, including overtime, LCI) | All sectors | 1450 | 0.5 | 2.0 |
| Private sector | 1448 | 0.4 | 2.0 | |
| Public sector | 1467 | 0.4 | 1.7 | |
| LCI analytical unadjusted | 1790 | 0.7 | 3.1 | |
| Dollars | Percent | |||
| Average ordinary time hourly earnings (QES) | 44.12 | 0.3 | 3.1 | |
Unemployment
Select chart tabs
4 Comments
Wonder why Bay of Plenty is 7%?
Watties shutting the plant? I'm uncertain of accuracy, but i have heard that without it, stonefruit growers will likely pull roots and shift focus due to the loss of baseline income.
The Watties and McCains restructures wont be included in those stats as the events have yet to occur
I don't think unemployment will get materially worse going forward. It seems that despite the current events overseas, the rate of redundancies has slowed. I'm not seeing or hearing of continuing cuts on Main St. Maybe we'll go sideways for some time instead.
We welcome your comments below. If you are not already registered, please register to comment
Remember we welcome robust, respectful and insightful debate. We don't welcome abusive or defamatory comments and will de-register those repeatedly making such comments. Our current comment policy is here.