
sign up log in
Want to go ad-free? Find out how, here.

A review of things you need to know before you sign off on Thursday; more retail rate rises, Fonterra stars, ANZ ups its payout forecast, fewer cranes in action, Kiwibank raises $¾ bln, swaps leap, bond yields leap, NZX dips, NZD falls, & more

Economy / news
A review of things you need to know before you sign off on Thursday; more retail rate rises, Fonterra stars, ANZ ups its payout forecast, fewer cranes in action, Kiwibank raises $¾ bln, swaps leap, bond yields leap, NZX dips, NZD falls, & more
[updated]

Here are the key things you need to know before you leave work today (or if you work from home, before you shutdown your laptop).

MORTGAGE RATE CHANGES
Kiwibank raised most fixed rates today. Details here. They were followed by the Cooperative bank. All current mortgage rates are here. And note, you can compare mortgage offers with our unique calculator that takes into account other costs and cashback incentives, here.

TERM DEPOSIT/SAVINGS RATE CHANGES
Kiwibank also raised some selected long term rates today. And so did BNZ. The Cooperative Bank and ICBC also raised some TD rates. Update: ANZ has raised its 1 year TD rate by +10 bps to 4.00%. All updated term deposit rates less than 1 year are here, for 1-5 years, they are here.

BIG PROFIT JUMP
Dairy giant Fonterra is paying farmer shareholders $9.69 per kilogram of milk solids and a total dividend for the 2025/26 year of 73 cents after reporting a $2.6 bln after-tax profit. This compares with their 2025 results of a $10.16/kgMS payout, a 57 cent dividend, and $1.1 bln NPATx.

WITH UPSIDE FOR DAIRY FARMERS
Now that this result is released, ANZ has raised its milk payout forecast for the new season to $9.80/kgMS, which is above the recent Fonterra mid-point of $9.50/kgMS.  (All major analyst forecasts are here.)

FEWER CRANES IN USE
The national construction crane count from RLB was just 106 at the end of September (58 in Auckland), up from 102 in June, but down from a peak of 157 in March 2022. In September last year the count was 116.

FEWER LOANS AT LOWER LEVELS
The RBNZ released its August data on residential borrowing by purpose today (C33) and that shows sagging new demand in all categories with new lending down -8.5% overall from July, down -4.9% from August a year ago. In fact, the average top-up loan is now down to levels last seen in 2020 (ignoring the Christmas periods). The average new purchase loan is back below $600,000. However the average loan shifted between banks is up marginally to $655,000 although still well below any month in 2025. 

NZX50 RETREATS
As at 3pm, the overall NZX50 index is down -0.5% so far. But for the past 5 trading sessions it is unchanged. It is up +8.3% from six months ago. From a year ago it is now up +4.3%. Market heavyweight F&P Healthcare is down -0.3% so far today. Gentrack, Vista Group, Briscoes, and Precinct Properties fell while Hallensteins, Sanford, Tourism Holdings, and Skellerup gained.

HIGHER YIELDS BUT STILL PLENTY OF SUPPLY
The Treasury raised $400 mln in two new bond issues today via a tender where they were offered $1.8 bln in 79 bids for the two maturities available. That was just a touch less than the $1.9 bln offered in 136 bds a week ago. Today's yields were +27 bps higher than the equivalent bond offered last week.

THEIR SHIP COMES IN
Kiwibank's $100 mln "plus oversubscriptions"  5 year bond issue has been received with strong demand of $965 mln. They have chosen to take $750 mln in this one, at a yield of 5.216% pa. This $750 mln is their largest-ever debt raise, beating the previous $650 mln in October 2023, and the $400 mln in December 2025.

WEALTHY NATION
In Australia, June 2026 data released today by the ABS shows household wealth there has reached AU$19.4 tln, driven by superannuation, but now held back by recently falling housing values. That is average per capita wealth of AU$694,500. There are a vast number of Aussie 'super' millionaires now.

GOOD LABOUR MARKET
Meanwhile, the August update of their labour force data shows +39,500 more jobs in the month with 14.827 mln people employed. But their jobless rate rose to 4.6% with 722,900 adults unemployed and a rise of +28,200 in a month. Hours worked and participation both rose and underemployment fell (slightly).

SWAPS JUMP
Wholesale swap rates will likely be much higher today, maybe as much as +15 bps. Keep an eye on our chart below which will record the final positions closer to 5pm. The RBNZ 90 day rate was up +2 bps at 3.19% on Wednesday. Today, the Australian 10 year bond yield has jumped +12 bps to 5.37% and its highest since 2011. The China 10 year bond rate is still at 1.67%. They are on holiday tomorrow. The Japanese 10 year bond is now at 3.06% and up +8 bps to a 30 year high. The NZ Government 10 year bond rate is now at 5.09% and up +14 bps from Wednesday and its highest since November 2023. (The RBNZ 10 year rate is 'prior day' and was down -3 bps at 4.92% on Wednesday.) And the UST 10yr yield is now at 5.12% and up +16 bps from yesterday, its highest in 24 years.

EQUITIES DROP
The NZX50 is now down -0.5% from yesterday's close. The ASX200 has opened down -0.6%. Tokyo is up +1.3% after returning from holiday. The KOSPI is closed today. Hong Kong has opened down -0.3% while Shanghai is down -0.6% at its open. Singapore is down -0.1% in early Thursday trade today. Wall Street ended down -0.8% on the S&P500, down -1.1% on the Nasdaq.

OIL PRICES UP
American oil prices have risen +US$1.50 from yesterday with the WTI benchmark now at just over US$91/bbl, while the international Brent price is just over US$102/bbl and up +US$3.50/bbl.

CARBON PRICE STALLED
There have been no trades reported again today, so far. The price is still at $52.50/NZU. See our daily chart tracker of the NZU price for carbon, courtesy of emsTradepoint.

GOLD LOWER
In early Asian trade, gold is down -US$49/oz from this time yesterday, now at US$4286/oz. Silver is a sharp -US$2.50 lower at US$64/oz.

NZD LOWER AGAIN
The Kiwi dollar is down -30 bps from yesterday, now at 56.8 USc. Against the Aussie we are up +30 bps at 80.7 AUc. Against the euro we little-changed at just on 49.9 euro cents. This all means the TWI-5 is remains just over 60.4 and down -20 bps from yesterday.

BITCOIN RETREATS
The bitcoin price is now at US$84,344 and down -2.4% from this this time yesterday. Volatility has been moderate at just on +/- 2.1%.

HOW THE GLOBAL ECONOMIC FORCES AFFECT US
If you want to catch up on what happened last night, try our Economy Watch podcast, here.

Daily exchange rates

Select chart tabs

Source: RBNZ
Source: RBNZ
Source: RBNZ
Source: RBNZ
Source: RBNZ
Source: RBNZ
Source: RBNZ
Source: CoinDesk

Daily swap rates

Select chart tabs

Source: NZFMA
Source: NZFMA
Source: NZFMA
Source: NZFMA
Source: NZFMA
Source: NZFMA
Source: NZFMA

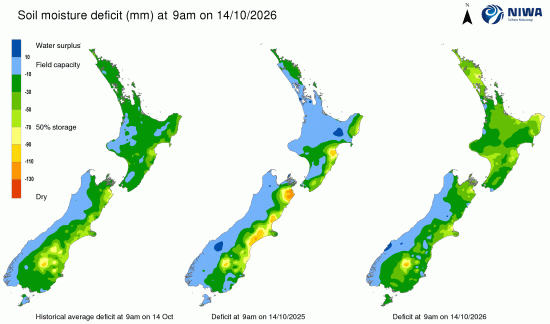
This soil moisture chart is animated here.

Keep abreast of upcoming events by following our Economic Calendar here ».

We welcome your comments below. If you are not already registered, please register to comment

Remember we welcome robust, respectful and insightful debate. We don't welcome abusive or defamatory comments and will de-register those repeatedly making such comments. Our current comment policy is here.

13 Comments

Not sure if anyone else follows the finance tweets on X/Twitter - but they are all of a twitter about the bond market that is currently imploding (ie higher interest rates/falling market prices). 

Chickens are certainly coming home to roost on the back of some pretty crazy fiscal, monetary and more recently geopolitical policies/decisions.

Up
7

It's certainly taken long enough.  Hopefully the right people are suffering.

Up
1

Yes, Independent, agreed.

Surely there comes a point in every pump-and-dump financial cycle when the argument ceases to be about personalities, economic schools or competing narratives and simply becomes a matter of looking at the numbers - I suspect we are getting remarkably close to that point in global sovereign bond markets.

Francis Hunt (The Market Sniper) recently drew attention to something I regard as particularly important. For some time the obvious trouble has been concentrated toward the long end of the US Treasury curve, where investors have increasingly demanded much greater compensation for lending money to Washington.

But now something considerably more interesting is happening - the trouble is moving closer to the present.

The 1, 2, 3 and 5-year portions of the yield curve have been repricing violently, with the greatest recent increases concentrated not at 30 years, but around the belly of the curve.

That, IMO, is critically important because a 30-year Treasury yield exploding higher can still be explained away as investors demanding a larger term premium for accepting three decades of inflation, fiscal and political uncertainty, but when investors begin demanding something approaching 5% to lend to Washington for only two, three or five years, it becomes a lot harder to dismiss.

And yesterday the US five-year Treasury broke through 5% for the first time since 2007, while the 10-year reached approximately 5.13% and the 30-year touched 5.41%.

To me this is no longer some theoretical problem lurking several decades into the future - it is progressively entering the refinancing window. Eventually Treasury discovers that it isn't escaping the interest-rate problem at all, it is merely shortening the fuse.

Every dollar financed at shorter duration must be rolled over sooner, which means that an ever-larger portion of the debt stock becomes exposed to whatever interest rate the market demands at refinancing.

That is why I regard the present movement in the short and intermediate Treasury curve as potentially much more significant than another few basis points on the 30-year.

The Feedback Loop

This is where the sovereign debt machine can begin feeding upon itself.

Higher yields increase federal interest expense.

Higher interest expense increases deficits.

Larger deficits require still more Treasury issuance.

More issuance requires still more buyers.

If those buyers demand greater compensation for absorbing the additional supply, yields rise again.

And the process repeats - the escape route is supposedly the Federal Reserve, but that merely introduces the other side of the trap. If the Fed ultimately has to suppress Treasury yields through renewed large-scale intervention, then the question becomes whether investors interpret that intervention as monetary accommodation of fiscal deficits.

At that point the problem begins migrating from the bond to the currency.

That is the potential bond/fiat feedback mechanism that I anticipate, because eventually the supposedly safest asset in the financial system begins asking a deeply uncomfortable question - safe relative to what - and measured in 'money' worth how much?

This is where sovereign debt risk and fiat-currency risk ultimately meet.

Nobody knows precisely when this process reaches its breaking point, but I increasingly suspect that arguing over whether the warning lights are actually illuminated is becoming rather pointless.

To me the dashboard is already beginning to look like a Christmas tree.


Up
6

Completely agree. 

Up
1

In early Asian trade, gold is down -US$49/oz from this time yesterday, now at US$4286/oz. Silver is a sharp -US$2.50 lower at US$64/oz.

Yes silver took a whack in US trading. The correlation between the oil and gold prices has broken down since March. Gold and oil historically moved together, but that relationship suddenly reversed after the U.S.-Iran war began.

With demand for gold still surging, particularly from China, there is suggestions of collusion between the US and China - China slowed its imports of oil and there's every reason to believe that the gold price is being suppressed, which works in China's advantage. 

Up
0

Phoenix, you've completely lost me with the US-China collusion theory.

China reducing oil imports is real, but it hardly requires a clandestine agreement with Washington to explain it. China accumulated enormous strategic inventories when oil was cheaper, then cut imports sharply when the Iran war disrupted Hormuz and prices exploded. Meanwhile it has been buying alternative Russian supply aggressively enough that Chinese demand has helped push the  ESPO price above $120/barrel.

But the gold argument seems even stranger.

China has already imported more than 1,000 tonnes of gold in the first eight months of this year, spending around US$159 billion, while simultaneously reducing its holdings of US Treasuries to an 18-year low. The PBoC reported another 20 tonnes purchased in August alone.

So yes, of course China benefits from a suppressed gold price.

Every enormous buyer benefits from buying its desired asset cheaply.

But that's a very different proposition from concluding that China must therefore be colluding with Washington to suppress it.

If anything, their strategic interests appear remarkably different: China is progressively exchanging dollar exposure for physical assets, while Washington has every reason not to advertise that trade by allowing gold to scream to the world that confidence in fiat claims is deteriorating.

And why would the breakdown of an historical oil/gold correlation establish anything sinister with the current massive forces at work? 

Oil prices  are presently being driven enormously by physical energy disruption around the Middle East - and gold by monetary conditions, real rates, central-bank accumulation, currency risk, and investment flows.

Sometimes a cheap price simply means the world's largest buyer gets to buy more.

Up
0

But that's a very different proposition from concluding that China must therefore be colluding with Washington to suppress it.

There is no proof that US is colluding with China on the gold price. What we do know is that after the start of the war, China cratered the price of oil. At the time, the Orange Swan visited China. It's just a theory suggesting China suppressed the oil prices while the US suppressed the price of gold. No proof whatsoever. All we know is that intervention has and will happen.  

Up
0

"There is no proof that US is colluding with China on the gold price."

And, so we are agreed on that point, Phoenix.

Given their increasingly divergent strategic interests over gold, Treasuries and the international monetary architecture, that proposition would require some pretty compelling evidence before I'd even begin to contemplate it.

Up
0

First-time homebuyers in the U.S. could get as much as $50,000 for a down payment on a house, under a draft bill to be introduced. Save $10,000, receive up to $50,000 in federal match, for $60,000 total toward a down payment.

There would be no income limit, but the home must be priced at or below the median home price in the buyer’s area.

https://www.merkley.senate.gov/merkley-proposes-housing-downpayment-savings-initiative/

Up
0

Why would anyone in the US upgrade / downgrade their house at the moment? Lose your 3% fixed for another 25 years and take out 7% fixed instead, seems crazy. Their market could jam up altogether, got to get the FHBs in to save it. 

Up
0

Despite rising yields, Japan’s net interest payments as a share of GDP are projected to remain among the lowest in the OECD in 2027. Almost exactly the same as Aotearoa. 

https://richardkatz.substack.com/p/factually-challenged-stories-claim

Up
1

Here we go - "The New Zealand Initiative". This should really be labeled a sponsored article. 

https://www.nzherald.co.nz/business/election-2026-is-shaping-up-to-be-b…

Up
1

Hmm... a paywall to access an article by arguably the most misnamed 'think-tank' in NZ - no, I'll pass on that one, thanks, nktokyo. 

Up
2