

Analysis by the World Gold Council.
Yes, volatility rose in 2025…just like other growth assets and in line with historical averages.
Amid tariff uncertainties, inflationary pressures and geo-economic strife, there is no shortage of market, macro and geopolitical risks to feed market volatility.
To get a sense of the turmoil navigated by investors this year compared to last, Chart 1 shows the realised volatility of gold, US stocks and US Treasuries.
Volatility has increased in both equity and gold markets, on the back of a supercharged geopolitical and geo-economic environment, with a significant surge in equity volatility around the initial tariffs announcement earlier in 2025. US treasury volatility on the other hand has been on a declining trend.
On the whole, all asset class volatilities remain broadly in line with their long-term averages.
Chart 1: Equity and gold volatility have increased in 2025…but gold’s vol is below average
1-year rolling weekly annualised volatility for US stocks, European stocks, US treasuries, silver and gold*
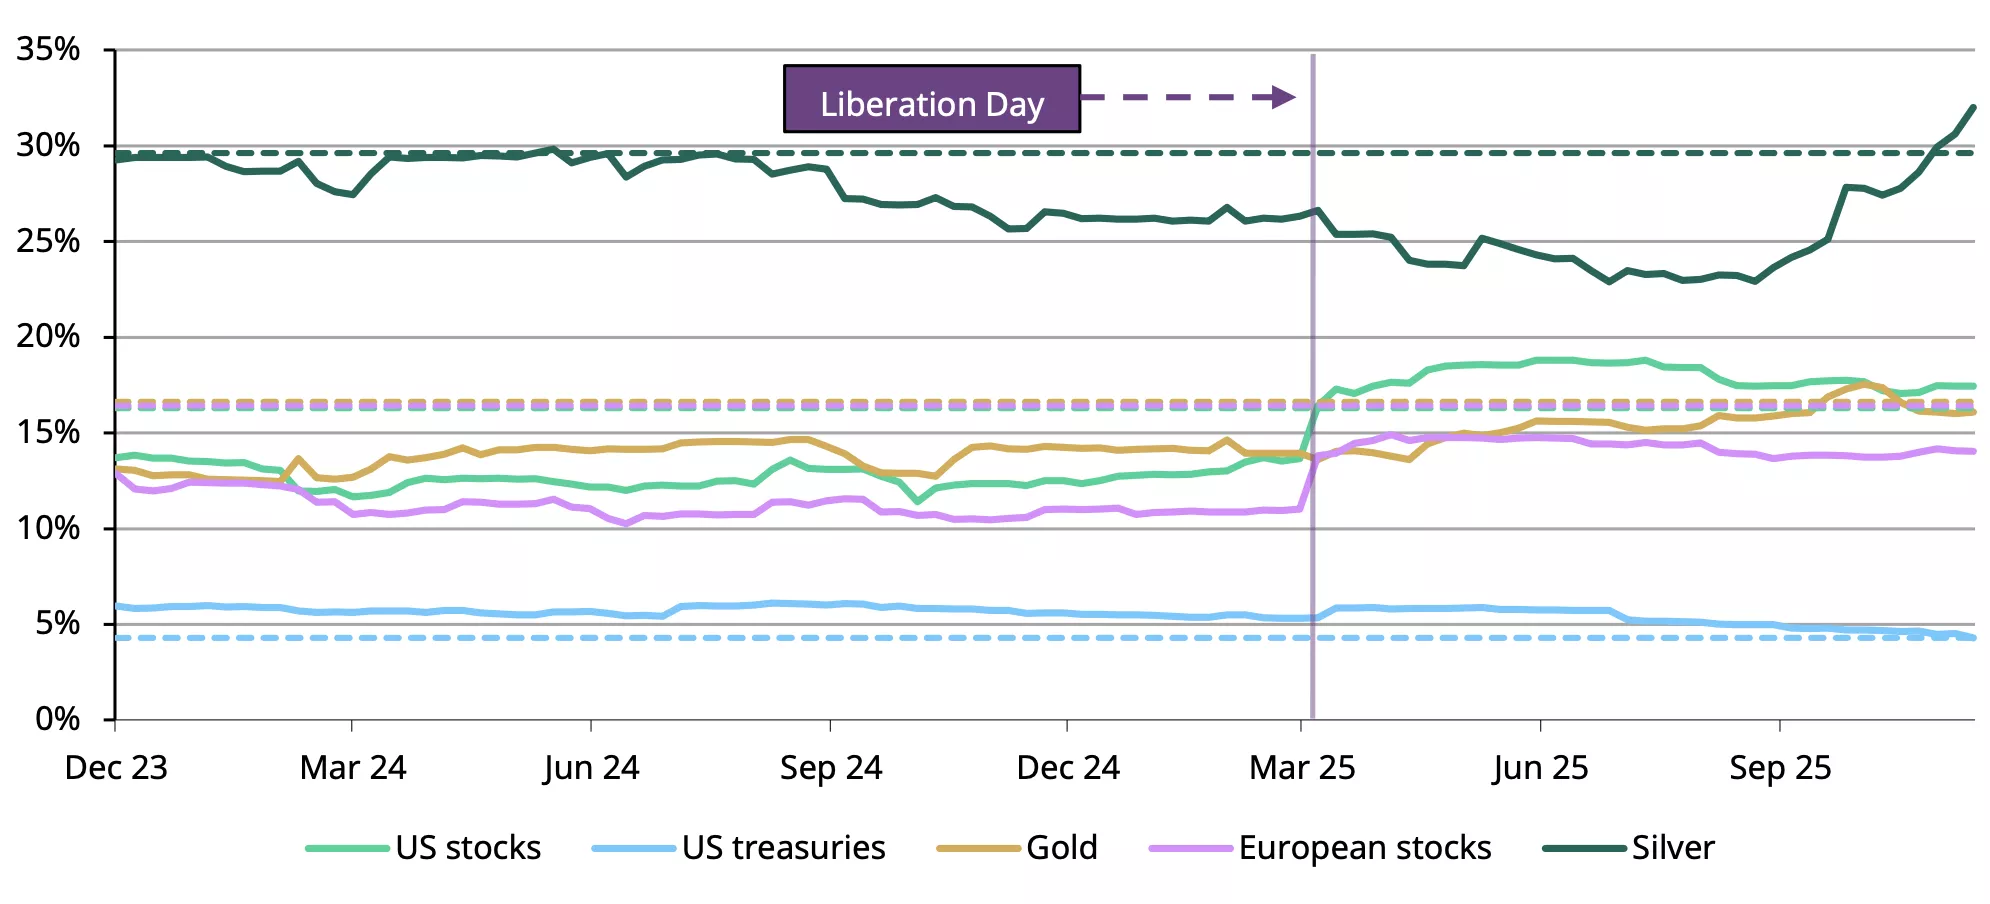
*Data as of 15 December 2025. Indices used: Bloomberg US Treasury Index, MSCI US Index, MSCI Europe Index, LBMA Silver Price, and LBMA Gold Price. Dashed lines represent the 20-year average volatility for the indices used.
Source: Bloomberg, World Gold Council
While gold’s volatility has risen alongside its strong price rally this year, it remains broadly in line with its long-term average and well below levels seen during previous periods of similar strong price performance (Chart 2). This suggests that, despite recent price strength, gold has moved in an orderly manner.
Chart 2: Despite the uptick in volatility in 2025, gold’s annualised volatility remains well below previous highs
Annualised gold volatility and returns*
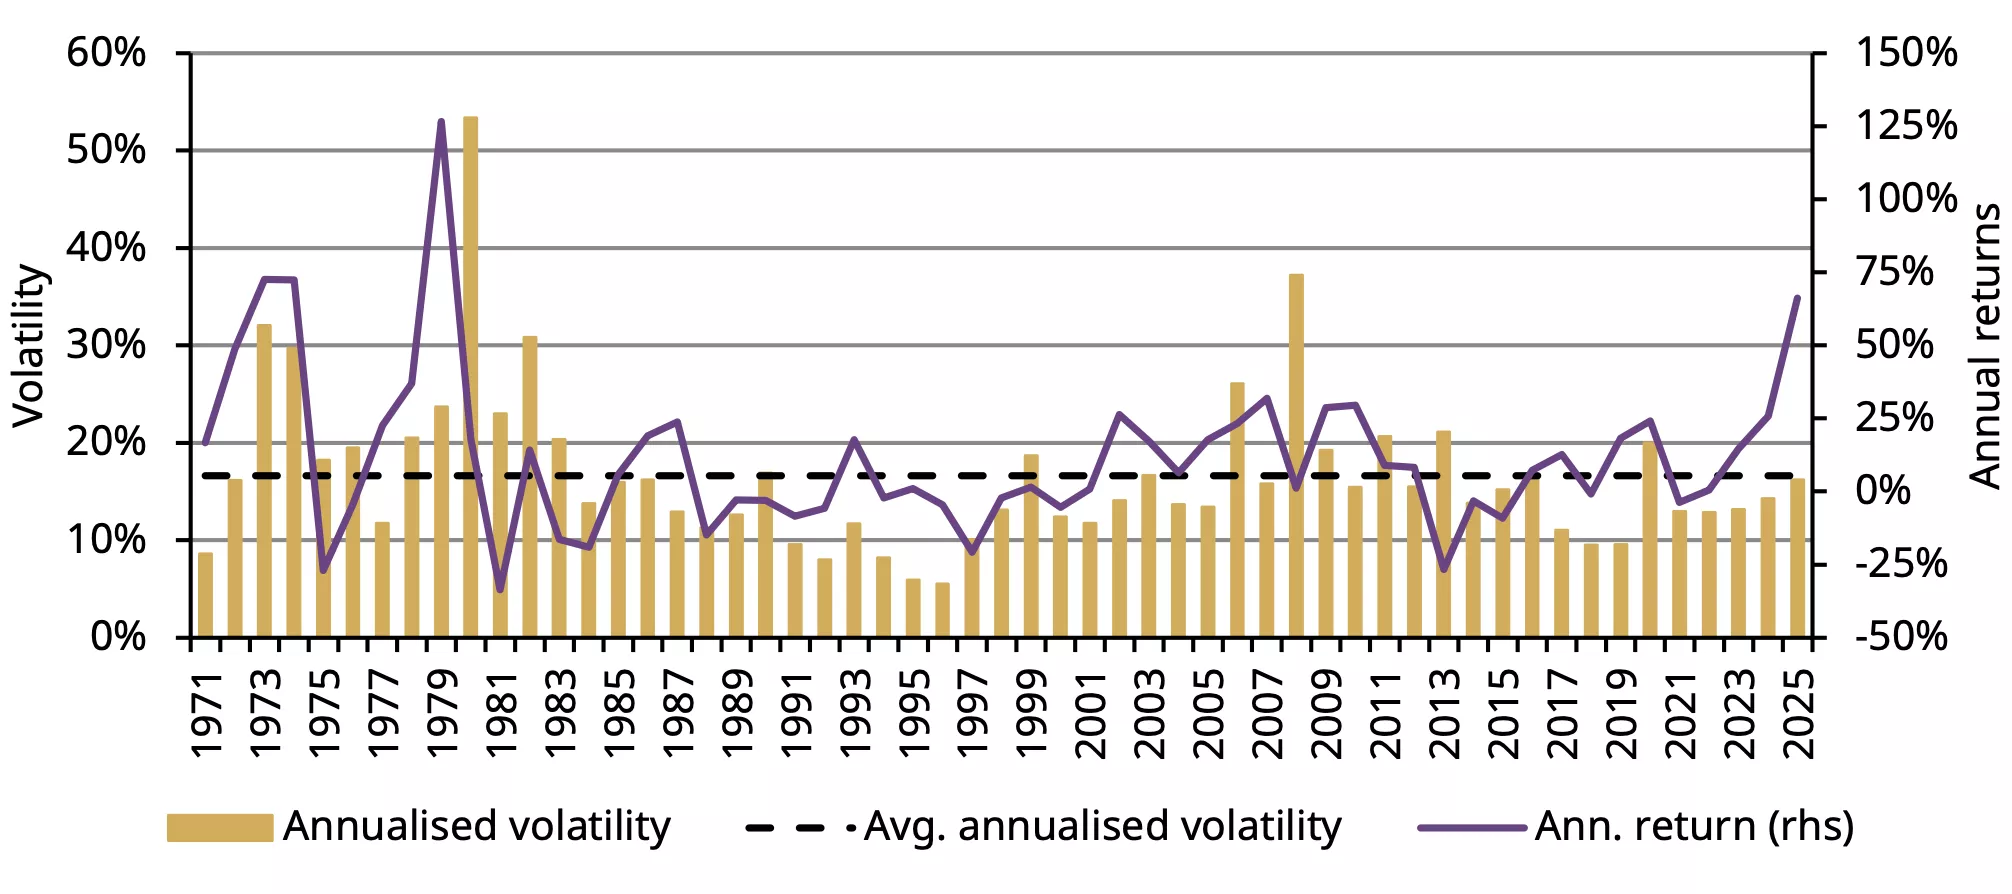
*Data from 1 January 1971 to 12 December 2025. Annualised volatility is calculated using weekly returns.
Source: Bloomberg, World Gold Council
What has this meant for portfolios?
The uptick in volatility across equities coupled with a positive correlation between stocks and bonds, has led to higher portfolio risk – a wake up call for investors to find alternative ways to manage portfolio volatility. This has become especially important now that we live in a world of diminishing diversification benefits (Chart 3).
However, we know that gold has been an efficient source of portfolio diversification with it’s low correlation to equities and fixed income assets (Chart 4).
Chart 3: The benefits of diversification have moderated over time, but it’s better with gold…
Portfolio diversification benefit, rolling 36m*
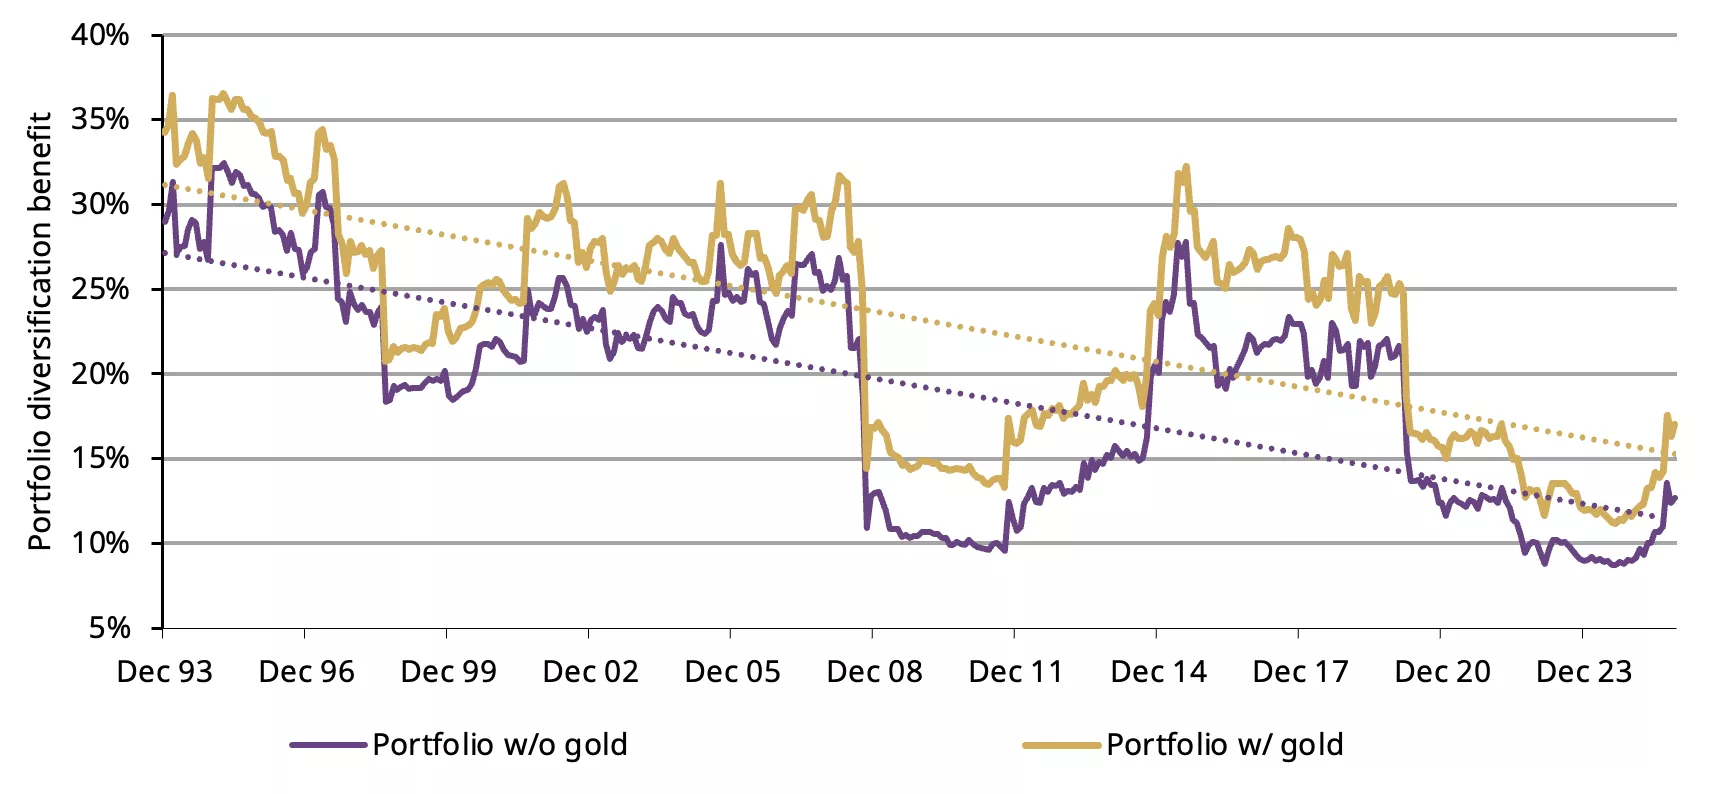
*Data from 31 December 1993 to 28 November 2025. Portfolio (without/with gold): US equities (35%/33.3%), EAFE equities (10%/9.5%), EM equities (10%/9.5%), US Aggregate bonds (30%/28.5%), US HY (5%/4.8%), REITS (10%/9.5%), Gold (0%/5%) rebalanced monthly. Diversification is calculated as %reduction in risk between weighted sum of asset volatilities and total portfolio volatility.
Source: Bloomberg, World Gold Council
Chart 4:…and has pushed investors to explore new uncorrelated assets like gold in their portfolios
Rolling 36m correlation*
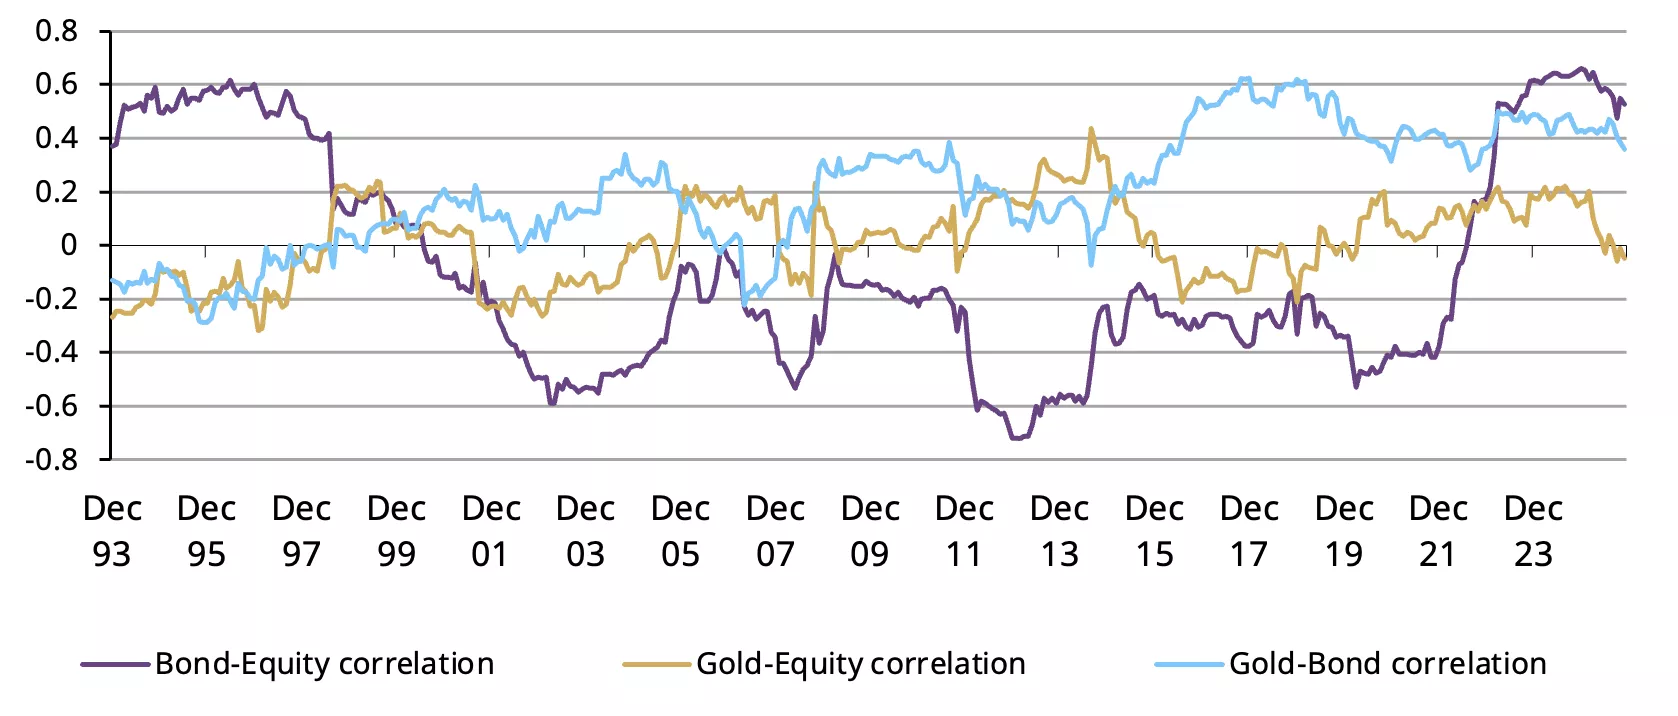
*Data from 31 December 1993 to 28 November 2025. Indices used: Bloomberg US Treasury Index, MSCI US Index and LBMA Gold Price
Source: Bloomberg, World Gold Council
Inflation and economic growth uncertainties affect stock-bond correlations differently: inflation shocks typically lead to positive bond-equity correlations due to its adverse effects on both asset classes; economic growth uncertainty on the other hand drives negative correlations as investors seek safety in bonds while stocks can suffer. We are currently in a low Growth vol/Inflation vol ratio environment, a signal of dominant inflation concerns.
Chart 5: Inflation is the dominant macro variable
Ratio of Growth/Inflation uncertainty and stock-bond correlation*
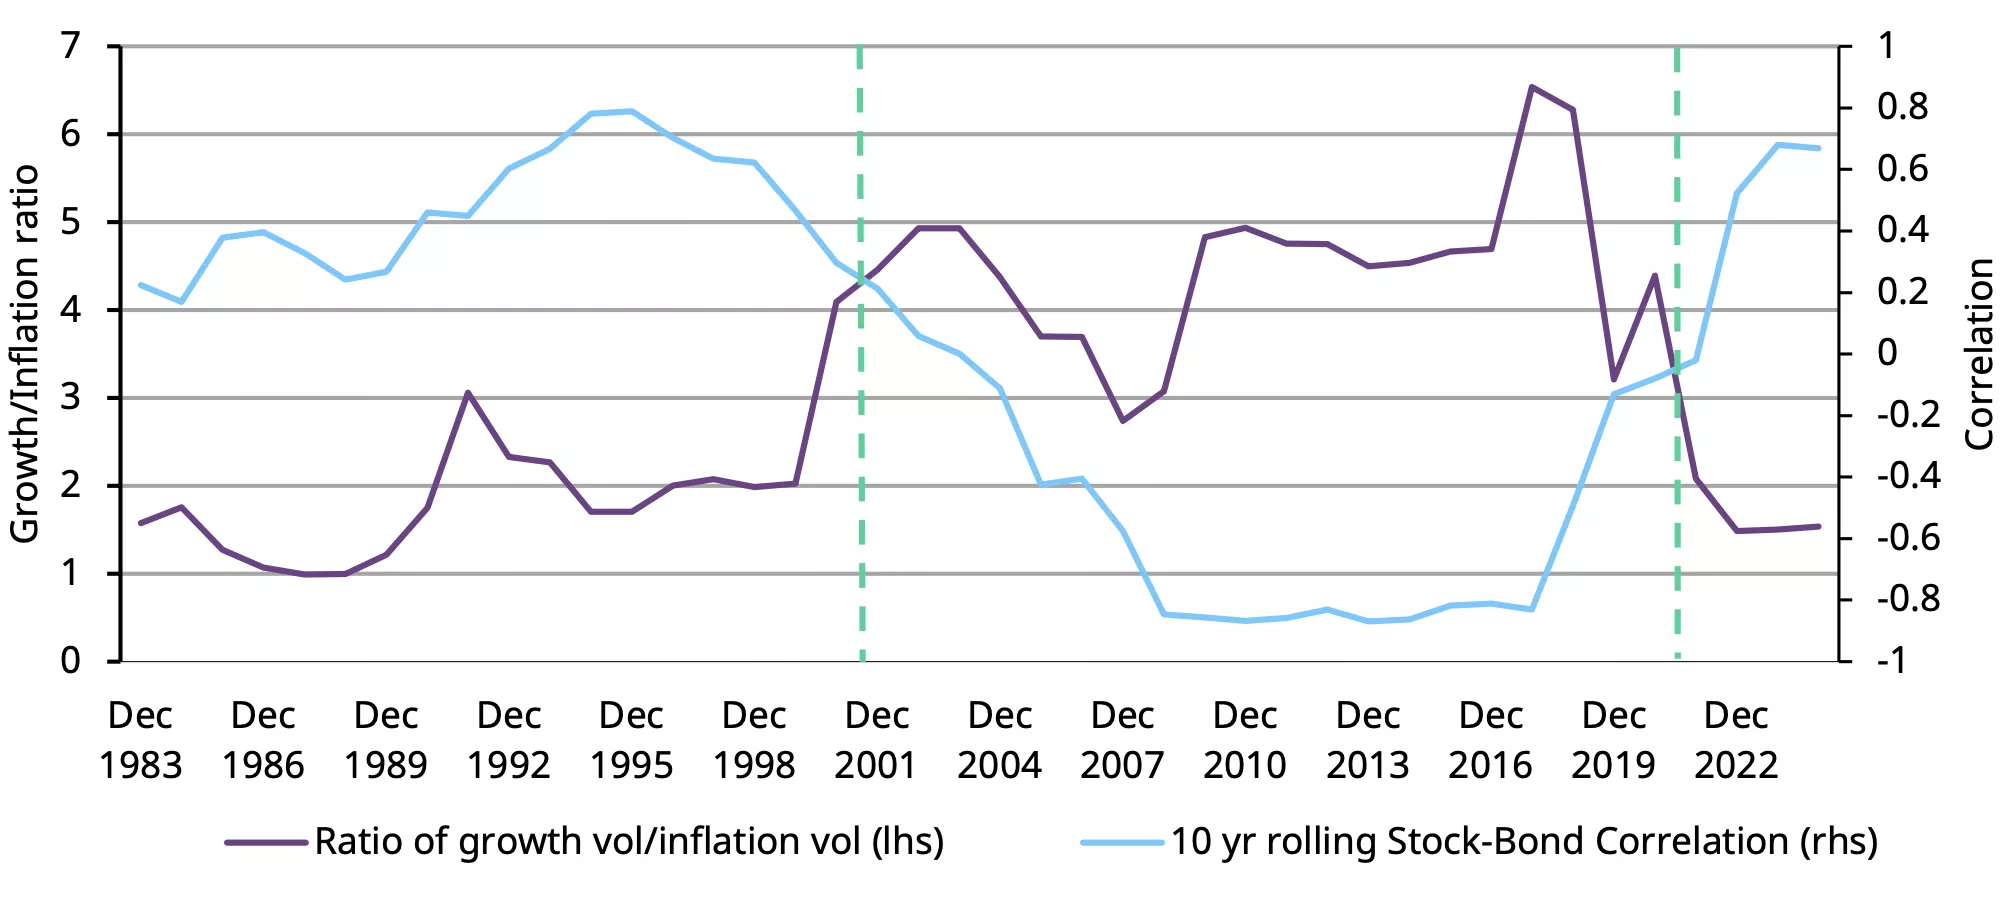
*Data 31 December 1973 to 30 September 2025. Growth/Inflation ratio was calculated using industrial production for growth volatility and US CPI for inflation volatility. Stock-bond correlation was calculated using S&P500 Index and Bloomberg US Treasury Index.
Source: Bloomberg, World Gold Council
In this current environment, adding gold to our hypothetical portfolio1 reduces the overall portfolio risk. In fact, adding 5% of gold reduces the portfolio risk by nearly 5% while its contribution to overall portfolio risk is negligible at 1.9% (Chart 6).
Chart 6: Portfolio risk has risen post 2022, but adding gold can reduce overall risk
Risk contribution and portfolio volatility during different regimes
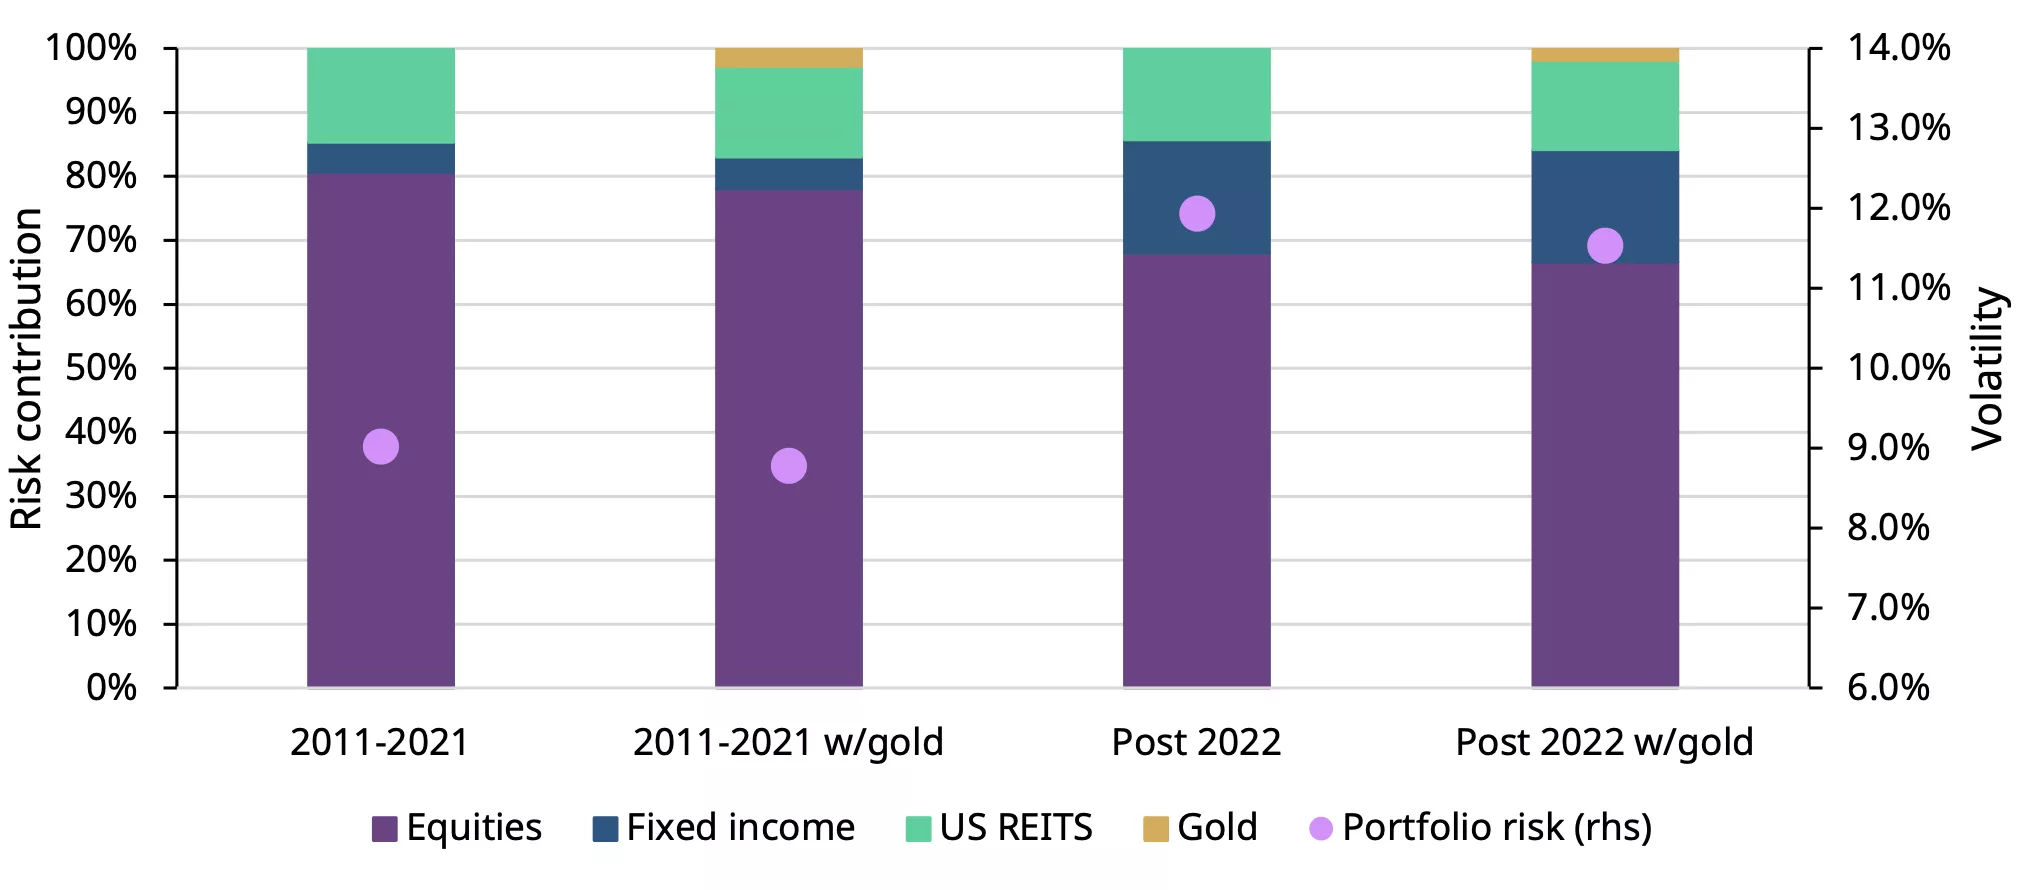
*Data from 31 December 2010 to 28 November 2025. Portfolio (without/with gold): US equities (35%/33.3%), EAFE equities (10%/9.5%), EM equities (10%/9.5%), US Aggregate bonds (30%/28.5%), US HY (5%/4.8%), REITS (10%/9.5%), Gold (0%/5%) rebalanced monthly. Risk contribution is calculated by multiplying each asset class weight by its weighted covariance with other assets, then dividing by the portfolio variance. Portfolio risk represents the volatility of the entire portfolio over the predefined periods shown on the chart.
Source: Bloomberg, World Gold Council
In summary
In a turbulent year marked by heightened macroeconomic and geopolitical risks, gold’s volatility has increased alongside that of other assets, including major equity indices. That said, its long-term behaviour has remained broadly consistent, and comparable to that of other growth assets.
While short-term surges in price and trading activity led to brief spikes in volatility, these episodes quickly normalised, underscoring gold’s resilience as a strategic asset.
Against a backdrop where traditional diversification benefits are waning, gold continues to play a valuable role in reducing overall portfolio risk, reinforcing its importance for investors seeking stability amid uncertainty.
Footnotes
1 The hypothetical portfolio shown in Chart 6 represents just one combination of assets; other combinations may produce different results.
This article is a re-post from here.
![]() Our free weekly precious metals email brings you weekly news of interest to precious metals investors, plus a comprehensive list of gold and silver buy and sell prices.
Our free weekly precious metals email brings you weekly news of interest to precious metals investors, plus a comprehensive list of gold and silver buy and sell prices.
To subscribe to our weekly precious metals email, enter your email address here.
Comparative pricing
You can find our independent comparative pricing for bullion and coins in both US dollars and New Zealand dollars which are updated on a daily basis here »
Precious metals
Select chart tabs
12 Comments
My five cents is that people are looking at gold as alpha, which has probably the wrong way to look at it. But it's understandable why given that people are programmed to anchor asset prices based on urban myths and matching the bogus inflation numbers. Not saying that alpha cannot exist with gold, but it's in the gold miners - GDX now up 152% in past 12 months. Historically unmatched and the best year ever for the proxy.
Similarly with rat poison. Disastrous year. And I'm taking great glee in watching the pious BTC maxis get humiliated. Why? These people have become little more than street preachers with a close-minded attitude towards debate. And even with BTC, the BTC maxis thought BTC treasury companies would be the alpha. They have performed far worse than BTC itself. The alpha has been in select BTC mining companies - like IREN, which is up 287% YTD.
GDX unsurprisingly at ATH right now, on both Gold and Silver shooting upwards to their own ATH. What a time to own precious metal, physically, through ETF's or Miners.
Yes Dr Y. Difficult to find large-cap miners that have outperformed GDX in 2025. Many mid‑tier and junior holdings show higher beta to bullion and have led performance in the current tape. OceanaGold has (+225%), but I had to sell it when it delisted from ASX in 2022 and for ethical reasons.
Toronto (TSE) is where the big gains have been YTD:
Orvana Minerals – About +796%, driven by multiple producing assets in Spain and Bolivia and renewed market focus on its growth pipeline.
Andean Precious Metals – Approx +566%, supported by its San Bartolomé plant in Bolivia and Golden Queen mine in California.
Troilus Mining – Around +378% on progress at its Troilus copper‑gold project in Québec.
Talisker Resources – About +319%, reflecting re‑rating on Canadian exploration results.
Thanks for the heads up. Of course it's always easy to tell which junior has performed well in hindsight. It would have been a brave person to invest heavily into Juniors at the beginning of 2025, let alone the "right" ones.
dp
GDXJ up 170% YTD. Pretty easy to hold that without understanding EOY outcomes over cash.
Sure, but it depends on your tolerance to risk. Personally, at the beginning of 2025, I would not have, and did not invest in a Junior, I found it just too risky compared to a a senior miner, which I did invest in being GDX.
How do you define your risk framework? Do you think GDXJ is like owning a speculative cryptocurrency?
GDXJ has an annualized total return over the past 10 years is roughly in the high‑teens to low‑20s % range. Since inception in 2009, the average annual return is much lower (around 2.6%–2.8%).
The worst calendar year for GDXJ since inception was 2013, with a total return of about −60%.
Generally speaking Junior miners have not yet produced s profit, Seniors have a longer history and proven record of actually extracting minerals successfully. I'm not saying one is better than the other, I'm simply saying that the risk profile is different, especially where we were and what we knew 11 months ago.
And Gold has just pushed through $4,400, it's quite likely to move near $5,000 quite quickly now.
Once silver kicks past $75 , $100 then in sight.
The ASX miners are all going nuts.
Generally speaking Junior miners have not yet produced s profit, Seniors have a longer history and proven record of actually extracting minerals successfully.
Well yes Dr Y. But GDXJ does pay a dividend. 1–2% depending on price reference date. Many of the larger positions are established producers (e.g., Pan American Silver, Alamos Gold, Equinox Gold, Royal Gold, Harmony, Evolution Mining), all of which pay dividends.
We welcome your comments below. If you are not already registered, please register to comment
Remember we welcome robust, respectful and insightful debate. We don't welcome abusive or defamatory comments and will de-register those repeatedly making such comments. Our current comment policy is here.