

Solid if not spectacular. That sums up 2025 for the Australian share market. The S&P/ASX 200, the key index, rose a respectable 6.8%. The total return including dividends was 10.32%, and higher again to the extent an investor could benefit from the franking (imputation) credits attached to dividends received.
While the market’s gain was good, it was lower than the two previous years.
Significantly, the ASX 200’s rise in 2025 was far from even. After a gain of about 3% in the first six weeks of the year, the index slumped 14% by early April to hit a low of 7,343. As it turned out, that was a fantastic buying opportunity. The following eight months saw the index rise over 23% to hit a high of 9,094 in October before dropping back a few percent in the closing months.
No doubt, there were many astute traders who profited handsomely from the large market fluctuations. Unfortunately, there were probably even more investors who took fright at the 20% plus decline mid-year and exited at or near the bottom of the market.
Much of the volatility in the Australian share market reflected the impact of the Trump presidency, including the Donald’s unpredictable tariff programme, his prickly relationship with the Federal Reserve, and his evolving attitude to Australia.
To be fair to the President, the US share market produced a great result in 2025. The S&P 500 soared 16.4% and produced a total return including dividends of nearly 18%. Of course, the American tech giants like Nvidia, Apple, and Microsoft dominate the index and have been the major contributors to the remarkable growth of the index in recent years.
Nvidia was up 39% in 2025 and now has a market cap exceeding $US4.5 trillion.
To put that in perspective, the market cap of the entire Australian market is only around $A3.3 trillion, or $US2.2 trillion. That’s what comes of a market dominated by banking and mining rather than information technology and communication services.
However, most Australians have participated indirectly in the US tech boom, and in the growth in US equities more generally, through their compulsory superannuation. Take for example the largest super fund in Australia, AustralianSuper, which manages more than $A400 billion of the retirement savings of over 3.6 million members. As at 30 June 2025, AustralianSuper had around $A85 billion invested in the US share market. Given subsequent market growth, that figure likely now exceeds $A90 billion.
The total US equity exposure across all Australian super funds would be in the hundreds of billions of Australian dollars. Of course, ‘exposure’ can work both ways. If (when?) there is a major fall on Wall Street, most Australians will feel it in their super. Until then, they’re happy to let the good times roll.
The other relevant exposure is the exchange rate. Over 2025, the Australian dollar rose nearly 8% against the US dollar. For unhedged Australian investors, that movement materially reduced the gain in US shares.
In the same period the Australian dollar also rose against the kiwi dollar, by about 5%. Given that the S&P/NZX 50 grew by just 0.25% in 2025, and produced a total return including dividends of only 3.34%, the currency movement made the NZ share market a losing proposition for Australian investors.
Most Australians will have enjoyed much higher returns than that in their superannuation funds. Initial indications are that most ‘balanced option’ super funds will have achieved around 9% growth in 2025, the third year in a row of 9%+ growth. (Note that generally Australians cannot access their super before they turn 60.)
As a result of good investment returns and an earnings super contribution rate set at 12%, Australians’ total super assets now exceed $A4.5 trillion.
Add to superannuation returns the 8.6% jump in house prices in Australia in 2025 and it’s been a good year for Australian investors.
Last November, Visual Capitalist released its ranking of countries by the number of US dollar millionaires per capita based on data from the UBS Global Wealth Report 2025. Australia came in at number three behind Switzerland and Hong Kong but ahead of the US.
Rank Country US$ millionaires per 1,000 Adults
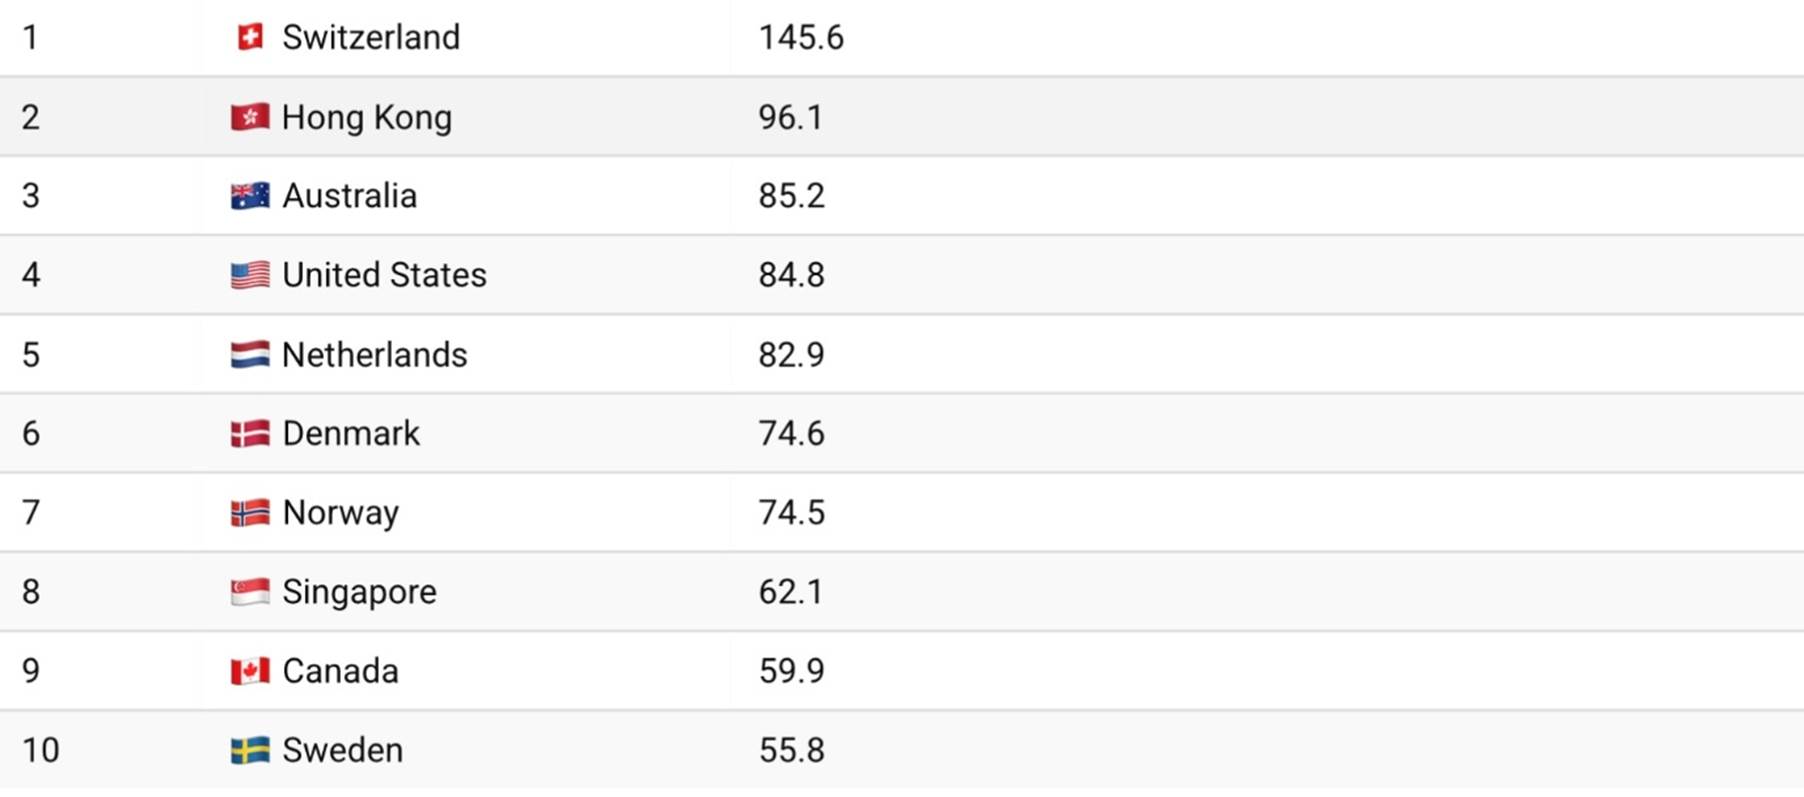
Source: Visualcapitalist.com
The UBS Global Wealth Report was based on data at the end of 2024. Since then, Australians have experienced robust growth in the share market, the housing market, and superannuation, plus an 8% appreciation of the Aussie dollar against the US dollar. That combination will likely have triggered a significant increase in the number of US$ millionaires down under.
But, as all good funds managers know, and as all their clients are constantly told, past performance is not an indicator of future performance.
The future is always uncertain and never more so than at the start of 2026. For Australian investors the most immediate concern is the possibility that the Reserve Bank of Australia will raise interest rates at its next meeting in February.
Beyond that is a world of worry about toppy international share markets, ever growing private and public debt, the emerging AI revolution, and a geopolitical landscape fraught with danger.
*Ross Stitt is a freelance writer with a PhD in political science. He is a New Zealander based in Sydney. His articles are part of our 'Understanding Australia' series.
5 Comments
New Zealand may not be very high in the list of "millionaires" per 1,000 people, having a score of around 40 however it is very high in the list of median wealth per adult at #6 (Australia #2). This is a better indicator of a fair distribution of wealth. The Swiss are actually below NZ on this list.
With 12% of wages and salaries being invested every week/quarter/annum what else would the market do....until it dosnt
The top 10 stocks make up roughly 47-49% of the S&P/ASX 200’s total market capitalisation, and close to half the index is concentrated in just 10 names. A standard large‑cap index called the S&P/ASX 20 is the flagship basket of the 20 largest and most liquid stocks on the ASX.
So describing Aussie as “the most concentrated share market in the world” is fair when comparing to major developed‑market benchmarks, largely because a handful of names (BHP, CBA, CSL, major banks) dominate the index.
this is a good site
We welcome your comments below. If you are not already registered, please register to comment
Remember we welcome robust, respectful and insightful debate. We don't welcome abusive or defamatory comments and will de-register those repeatedly making such comments. Our current comment policy is here.