
By Amanda Morrall
As a long-term saving vehicle, short-term KiwiSaver results provide little more than vain hopes of becoming a grey-haired millionaire. As an investor, you're stuck in for the long-haul so you need to take those delicious double-digit returns -- built on the back of market healing -- with a generous dose of salt.
This year's winners are invariably doomed to become next year's losers reinforcing that well-worn mantra in the investment community that past performance is no indication of future performance.
As evidence of that, some of the better performing equity-intense funds have delivered 10%-23% returns. Default funds, a darling during the downturn, are starting to look lacklustre by comparison, even though they averaged the best returns overall in the past three years.
The turn-around has some in the industry calling for a retreat from fixed-interest toward a bigger embrace of equities. But with so much global uncertainty, political and economic, as an investor, it's hard to know which way to turn or who to trust with your money.
So how do you know if your fund is going to be a long-term laggard, a first-place finisher, or a middle-pack underdog that will pass the test of time?
Basically, it's too soon to tell. Track records less than five years old don't often hold much weight with more discriminating investors who want to bank on reliability.
Performance data accumulated thus far, as young and flawed as it might be because of inconsistent reporting methods, is nevertheless taking shape. Iron out the highs and lows of year-on-year rises and falls and you're left with annualised returns that can now be teased out for three years.
In a perfect world, performance benchmarks would post returns after-tax and management fees, but with the exception of Mercer and Gareth Morgan none of the providers are doing this, yet. That could change following a regulatory review of KiwiSaver meant to tie up loose ends.
What we're left with is a very broad brush performance benchmarking approach that calculates returns on the basis of what information the various providers choose to disclose to the research houses. Outfits like Morningstar, and FundSource have tried to calculate returns in an consistent way as possible but they aren't without shortcomings.
In an attempt to provide a more accurate assessment, interest.co.nz has come up with a performance adjusted returns ranking. Our figures were calculated by deducting fees and expenses (not typically included in a fund's reported returns), in a standard and consistent way.
Our performance adjusted figures include the fixed dollar 'membership fees' that almost all funds charge. We've also taken into account things like trustees expenses and management fees and combined them to produce an 'expense ratio' similar to what's presented in more mature investment markets overseas. We used a balance of NZ$10,000 to arrive at a percentage fee.
Our findings (as of Dec.2010) show you how your fund has performed one, two, three years when stripped of fees and expenses but including tax.
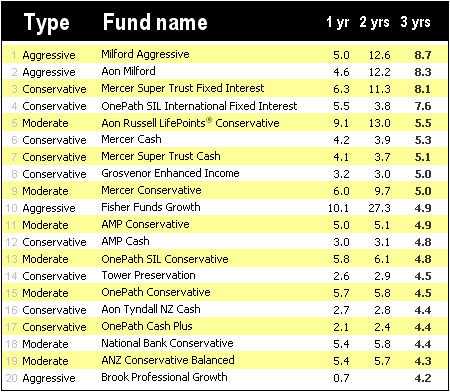
For interests sake, we pooled the funds across all categories (conservative, balanced, moderate, growth and aggressive), and ranked 20 of them in descending order by three-year rates of return.
Among the more interesting findings was that a conservative fund could deliver as well as a growth fund.
According to our calculations, Mercer's Super Trust Fixed-Interest fund has turned out a 8.1% annual return over three years, just six basis points shy of the highest returning most aggressive fund managed by Milford Asset Management. Over the same period of time, that particular fund produced an annual performance adjusted return of 8.7%. It was followed closely by Aon Milford at 8.3% and then Fisher Funds Growth, which produced 4.9%.
For our complete list of performance adjusted funds in their respective peer groups, go to our KiwiSaver performance section and scroll down through the fund types.
To get a comparative break down of fees by fund type, go to our KiwiSaver fees and expenses section.
We welcome your comments below. If you are not already registered, please register to comment
Remember we welcome robust, respectful and insightful debate. We don't welcome abusive or defamatory comments and will de-register those repeatedly making such comments. Our current comment policy is here.