Summer chart series: The chart that shows how unbalanced our economy is

31st Dec 09, 9:01am
by
Bernard Hickey picks out 10 charts from 2009 in a series of videos to play over the Summer break. In this video he looks at how the tradeable sector (exporters and those competing with imports) has suffered since 2004 relative to the non-tradeable sector (government, real estate, financial services, health, education). The housing boom has redirected investment into housing at the expense of the productive sector, which is unsustainable over the longer term if New Zealand wants to improve productivity, lift real wages and reduce the emigration of New Zealanders to Australia. 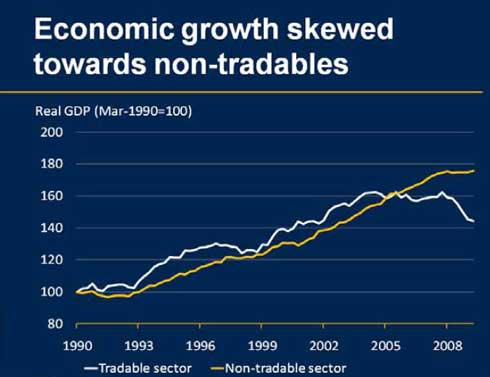
We welcome your comments below. If you are not already registered, please register to comment
Remember we welcome robust, respectful and insightful debate. We don't welcome abusive or defamatory comments and will de-register those repeatedly making such comments. Our current comment policy is here.