
 By Rodney Dickens This report provides an overview of the state of demand for sections in the parts of the Northland coastal market covered in the previous reports although excluding Paihia and Russell. It looks at what has happened to the number of section sales and section prices, as well as providing a ballpark assessment of the demand-supply balances in the various markets. The demand-supply balances vary significantly from market to market, but in general the Northland coastal section market is not close to "clearing" yet (i.e. asking prices are still in general too high relative to what buyers are willing to pay). The section market is of major importance to the existing house market because an existing house is just a depreciating asset sitting on a piece of dirt, so what happens to section prices has a major bearing on existing house price prospects.
Section sales are running at around pre-boom levels The charts below show the quarterly number of section sales reported by QV for the five areas in Northland we are revisiting. In all cases the number of sales has returned to pre-boom levels. The QV data for the 2009 September quarter will understate the number of sales because not all sales that occurred in the quarter will have been reported to QV yet. Similarly, some of the sales that occurred in the June quarter, and to a lesser extent in the March quarter, will not have been reported to QV yet. This deficiency aside, the QV data, when fully updated, better reflect the number of sales than the REINZ monthly data because the QV data includes both sections sold via real estate agents and sections sold by developers direct to buyers. 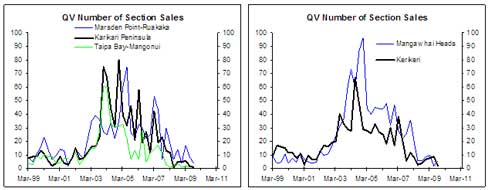 The left chart shows the extent of the mega-boom in section sales in the five selected Northland areas compared to what seemed like a major boom in national section sales between 2002 and 2007. All would have been fine if the sections sold in these hotspots were largely to end-users, although of the five areas this was more the case in Kerikeri.
 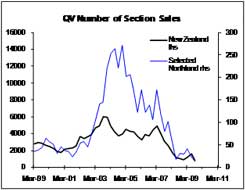 However, lured by the promise of quick capital gains many buyers were spec buyers/investors and the problem now facing developers is that to a greater or lesser extent they are competing with the spec buyers/investors for the low level of demand. The problem is being helped to some extent at the moment as low interest rates and higher population growth fuel demand for new housing and sections, but this is more an urban story than a coastal story. The Far North Revisited The monthly REINZ data are more up to date than the quarterly QV data, although they don't pick up all section sales. The left chart below shows the number of section sales reported by REINZ for the Mangonui area, which overlaps significantly with the combined Karikari Peninsula and Taipa Bay-Mangonui areas in the QV data. The Mangonui area is one of the parts of the coastline where investors played a major part in funding new subdivisions, while it is also an area where the number of sales is showing little sign of recovering yet. Prior to the boom years section prices in the Mangonui area were generally 30-40% below the national median section price, but at the peak of the boom they sold at a premium (right chart). However, a semblance of normality has returned with median section prices in Mangonui at a 24% discount to the national median in the last year.
 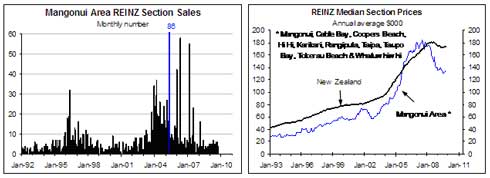 However, this doesn't mean equilibrium has returned to this market in terms of demand and supply being in reasonable balance because there are still lots more would-be vendors than there are eager buyers. In the year to October 2009 REINZ reported 59 sections being sold in the greater Mangonui area, while we found 498 ads for sections for sale in this area on www.realestate.co.nz, which doesn't include either the significant number of sections people are trying to sell privately on www.trademe.co.nz nor the unknown number of sections developers are trying to sell direct to the public. The 498 ads will include an element of double counting related to multi-listing. However, when we do in-depth research of the for sale ads we often also find ads that relate to more than one section being for sale, which is especially the case where a developer is using a real estate agent or agents to advertise a stage of a subdivision. So even if we dredged through the ads in detail, as we do when we undertake research for paying clients, the net result would still be a demand-supply balance heavily over-weight on the supply side. In many cases the coastal property markets are still some way from "clearing" and are best described as being "illiquid". A feature of which is a low level of sales compared to the supply available to sell and many would-be vendors not being willing to drop prices to the levels needed to achieve sales. Kerikeri Revisited The left chart below shows the monthly number of section sales reported by REINZ for Kerikeri, with the numbers recently running at around pre-boom levels. After booming between 2004 and 2008 relative to the national median section price, the median section price in Kerikeri has fallen back in line with the national median (right chart below). REINZ reported 47 section sales for Kerikeri in the year to October 2009, while as at 23 November there were 565 section-for-sale ads for Kerikeri on www.realestate.co.nz. A quick scanning of the for sale ads shows that a key feature of the supply-side of the Kerikeri market remains lots of lifestyle-type sections scattered all over greater Kerikeri area. Like the Mangonui area, the Kerikeri section market is categorised by supply greatly exceeding demand.
 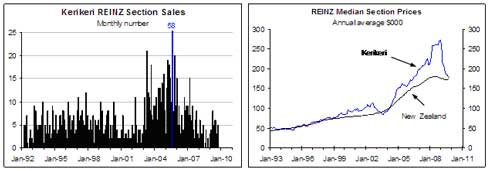 Mangawhai Heads and Mangawhai Revisited Otamatea is dominated by Mangawhai Heads and Mangawhai, with the number of REINZ section sales in this combined area showing signs of revival in the last couple of months (left chart above), although it is possible the surge in the number of section sales in October in part reflects settlement on a stage of a subdivision that sold some time ago. In the early 1990s the median section in the Mangawhai area was at 20-30% discount to the national median section price, with the post-boom collapse in demand seeing the local median section prices again at a 30% discount to the national median over the last year (right chart above). This doesn't necessarily mean that everyone trying to sell a section in Mangawhai will have to sell at a 30% discount to the national median price because this area has a significant diversity of sections in terms of quality/features.
 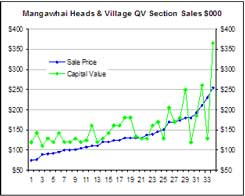 We paid for data on section sales over the last 12 months in three sub-areas of Mangawhai Heads and Managwhai, with the chart showing the sale prices and capital values (CV) at the time of sale for 34 of the most recent section sales reported to QV as at 23 November. The sections are ordered from lowest to highest priced, while we excluded larger-lifestyle sections. Of the 34 most recent section sales, the sale prices were on average 12% below the CV at the time of sale. However, of the 17 lowest priced sections, all of which sold for under $130,000, the sale prices were on average 22% below the CV at the time of the sale. The picture is mixed for the higher priced sections, no doubt partly reflecting a realignment of "value" but possibly also in part reflecting some questionable CVs. In the case of Otamatea, which is dominated by Mangawhai Heads and Mangawhai, REINZ reported 92 sales in the year to October 2009, which was dominated by the 39 sales in September and October. This compares to 417 section-for-sale ads on www.realestate.co.nz. Again, this doesn't include the significant number of sections for sale privately on www.trademe.co.nz, nor most likely some of the sections for sale by developers. The Otamatea numbers stack up less badly than do the Mangonui area numbers in terms of the size of the stock of sections for sale compared to recent turnover levels. However, in both cases there are adverse demand-supply balances and the risk that the local median section prices will ultimately end up at larger discounts to the national median section price than was the case in the early 1990s. The much closer proximity of Mangawhai to Auckland should help this market clear faster, but on the other hand the "quality" of the product is often lower here compared to in the greater Mangonui area where a larger proportion of sections have extensive sea views and there is generally better beach access. One Tree Point-Ruakaka Revisited The One Tree Point-Ruakaka-Marsden Point area is lumped into Whangarei County by REINZ, which includes lots of other coastal and country areas around Whangarei City (see the charts below for the REINZ data for Whangarei County). However, because we are in the process of undertaking an in-depth study of this market we are able to supply some more useful insights than provided by these charts.
 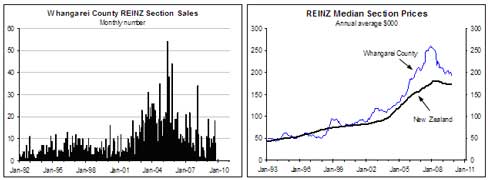 Based on the QV data only 34 sections have sold in the Marsden Point-Ruakaka area in the year to September 2009. This will underestimate the actual number of sales by up to 20% because not all of the sales that occurred over this period will have been reported to QV yet. This compares with 127 section-for-sale ads on realestate.co.nz as at 23 November. So at face value the demand-supply balance in this part of Northland looks less challenging for would-be vendors. However, in our in-depth research of the Marsden Point-Ruakaka area, which included detailed analysis of 12 subdivisions, we found over 300 sections for sale. This excluded sections larger than 2,150 m2 and was after removing multi-listings. We found 231 sections for sale that specified asking prices, with the left chart below showing the number of sections for sale by asking price brackets. We found 319 sections for sale with specified sizes, with the right below showing the sections by size brackets. The bulk of sections had asking prices in the $150-300k range, with many of these sections having neither direct beach access or sea views. However, there were also a significant number with asking prices in the $600-900k range, largely reflecting the Marsden Cove marina development. Section sizes are pretty standard with the bulk in the 600-800 m2 range.
 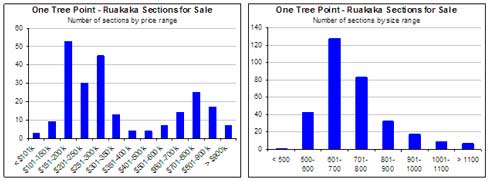 Prior to the start of the boom in 2003 the median section price in Marsden Point-Ruakaka was just under $90,000 based on the comprehensive QV data, which was close to the median sales price in Whangarei District and a bit below the national median prices (left chart above). Between 2003 and 2005 the local median section price surged relative to the district and national medians. This appears to in part reflect a larger increase in local section prices but possibly more important was the advent of Marsden Cove in 2005, which offered superior sections at much higher prices (i.e. a change in the composition of sales will have accounted for a sizeable portion of the apparent outperformance of section prices). Equally, the larger fall in the local median section price relative to the experience in the district and nationally since 2007 in part reflects local section prices falling more but also in part reflects fewer of the better quality, higher-priced sections selling. The performance of the Marsden Point-Ruakaka median section price relative to the median prices for some other coastal areas provides some useful insights, as discussed below (see the right chart above). A feature of the One Tree Point-Ruakaka market, which is a common feature of many coastal markets, is asking prices generally above prices being achieved in the market place. The median asking price of the sections we found for sale in the local area was $285,000, while the median achieved sale price in the last year was half this level. Better quality sections in this area will still sell for above average prices, but in general there appears to be a major imbalance between asking prices and the sort of prices people are currently willing to pay. We will address this issue in some detail in the forthcoming pay-to-view report on One Tree Point-Ruakaka. The forthcoming report will look at the individual subdivisions in some detail including assessing achieved section prices relative to capital values. It will look at how One Tree Point-Ruakaka stacks up relative to competing coastal markets. It will assess likely demand for sections including containing details and some analysis of the industrial land market, with several significant industrial parks being developed. Putting the Northland markets in the context of national developments As discussed in the pay-to-view Housing Prospects and Building Barometer reports, a reasonably strong cyclical upturn in section sales has occurred nationally this year, driven by low interest rates and stronger population growth and aided to some extent by lower section prices. The Northland coastal and resort areas will have benefited to some extent by these developments. However, the boost in demand has so far made only a limited dent in the supply-side of sections in these markets. We believe these over-supplied markets will be a greater risk when the next downturn in national demand occurs, the timing of which is discussed in our pay-to-view reports. Ultimately, we expect the adverse demand-supply balances to result in median section prices in most if not all of these Northland areas being lower relative to the national median section price than was the case before the boom, but it looks like being a slow adjustment process. When would-be vendors are not willing to cut asking prices sufficiently to clear the market, the number of sales will remain low. When sale volumes are low the sections that sell will generally overstate the "equilibrium" or "clearing" level of prices. This is because the relatively small number of sections that are selling are generally selling to the small group of buyers willing to pay top-dollar. However, with the volume of sales low it means it will take a long time to sell the number of sections in search of new owners, which means the adjustment in sections prices will be a drawn out affair although part of the adjustment will come via inflation eating into asking prices. _________________ * Rodney Dickens is the Managing Director and Chief Research Officer for Strategic Risk Analysis (SRA), which is a boutique economic, industry and property research company. Rodney produces regular free reports on topical issues and on specific property markets. Find out more about SRA here and sign up to SRA's free reports here.
We welcome your comments below. If you are not already registered, please register to comment
Remember we welcome robust, respectful and insightful debate. We don't welcome abusive or defamatory comments and will de-register those repeatedly making such comments. Our current comment policy is here.