By Paul Conway and Lisa Meehan
NZ Productivity Commission
Introduction
[Our] paper provides a comprehensive assessment of New Zealand’s productivity performance for the whole economy and for individual industries.
It describes New Zealand’s productivity performance through time and in comparison to other OECD countries.
The focus is on illustrating productivity trends and the paper does not assess in detail the underlying reasons for New Zealand’s poor productivity performance (the subject of on-going Commission work).
The paper’s overall finding of a generally poor productivity performance – both at the economy-wide and industry levels – underscores the need for New Zealand’s policy environment to be strongly supportive of productivity growth and for firms to have a clear focus on improving productivity.
Many initiatives to improve productivity are also industry specific, requiring a detailed understanding of productivity performance at this level.
The paper provides that perspective and is intended to be a helpful resource for policy-makers and industry leaders. It also provides an important foundation for deeper debate on New Zealand’s generally poor productivity performance.
Why productivity matters
“…nothing contributes more to the reduction of poverty, to increases in leisure, and to the country’s ability to finance education, public health, environment and the arts.”
Alan Blinder and William Baumol (1993)
Productivity refers to the efficiency with which resources – such as labour and capital – are converted into outputs of goods and services.
Productivity improvements mean that more output can be produced using the same amount of resources, allowing countries to enjoy higher living standards, including improved health, education and environmental standards.
Productivity growth is a means to an end – improvements in wellbeing.
So while productivity growth contributes directly to higher incomes and material standards of living, this matters to the extent that it enhances the wellbeing of New Zealanders.
A society can also achieve higher incomes by working harder (ie, increasing hours worked per person) or getting higher international prices for its exports (ie, higher terms of trade).
In New Zealand, productivity growth has been an important contributor to income growth over recent decades. New Zealand has also enjoyed strong employment growth – particularly over the 1990s – and good terms of trade gains over the 2000s.
But there are natural limits to employment growth, especially in the context of population aging, and the terms of trade cannot keep rising indefinitely.
So productivity growth will become increasingly important as a source of higher incomes for New Zealanders.
Overall economy-wide performance
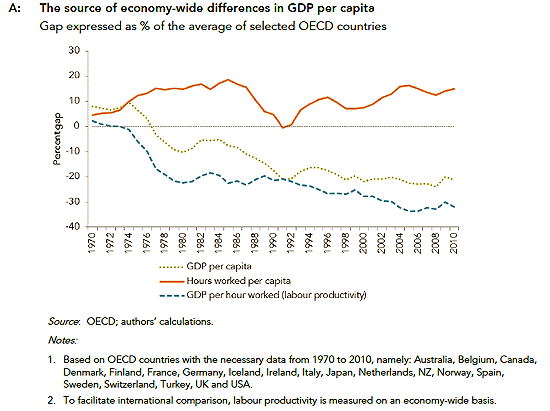
New Zealanders put in plenty of hours at work, but lag behind other countries in the amount of goods and services produced from each hour on the job.
From the mid-1990s, New Zealand has been very successful at increasing participation in the labour market and employment growth has been among the strongest in the OECD. It has also enjoyed periods of good productivity growth – such as the mid- to late-1990s.
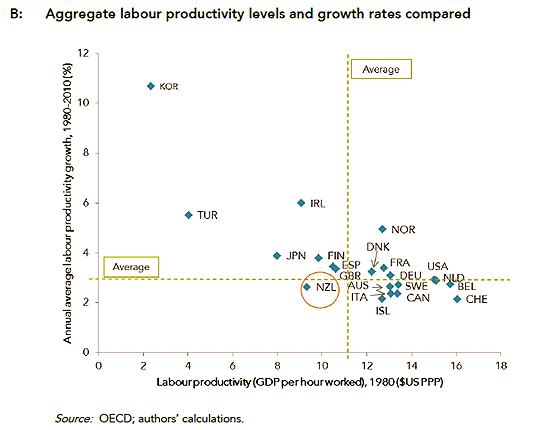
But overall, New Zealand’s productivity performance has been poor compared with other developed economies.
Indeed, for a number of decades, New Zealand’s labour productivity has been falling behind other OECD countries.
Labour productivity growth has also slowed considerably in New Zealand in the 2000s compared with the 1990s.
So as well as having a low level of productivity, New Zealand also has one of the lowest rates of productivity growth in the OECD.
This is unusual internationally and raises serious concerns.
Comparison across industries within New Zealand
There are wide differences in productivity levels and growth rates at the industry level:
- Since 1978, labour productivity growth has been stronger in the primary sector relative to the goods-producing and services sectors.
- Some industries – such as information, media & telecommunication and finance & insurance – ‘punch above their weight’ by contributing a much larger share of aggregate productivity growth than their size as a share of GDP.
- Other industries – such as construction and some low-productivity-growth service industries (such as the relatively large professional, scientific & technical services industry) – have detracted from New Zealand’s aggregate productivity growth over recent years.
- The productivity growth slowdown over the 2000s has been reasonably broad based with all but three industries having slower productivity growth in the 2000s compared to the 1990s. However, the transport, postal & warehousing and agriculture, forestry & fishing industries have made the largest contributions to the slowdown.
- Since the onset of the Global Financial Crisis, falls in productivity growth have been most pronounced in some of New Zealand’s service industries.
While there are clear areas of relative over- and under-performance at the industry level, a deeper understanding of the underlying causes of industry performance requires more detailed industry-specific studies.
Comparison with other countries
On average, New Zealanders work about 15% longer than the OECD average and produce about 20% less output per hour worked.
New Zealand’s labour productivity now ranks in the lower third of OECD countries and is similar to that in Slovenia, Israel and the Slovak Republic.
It is because of this poor labour productivity performance that GDP and average incomes per person are low in New Zealand.
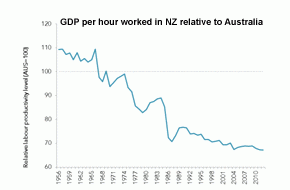
Closer to home, New Zealand and Australia have had remarkably similar employment growth since the mid-1950s.
But Australian firms have been much more successful than their New Zealand counterparts at converting that labour input into output.
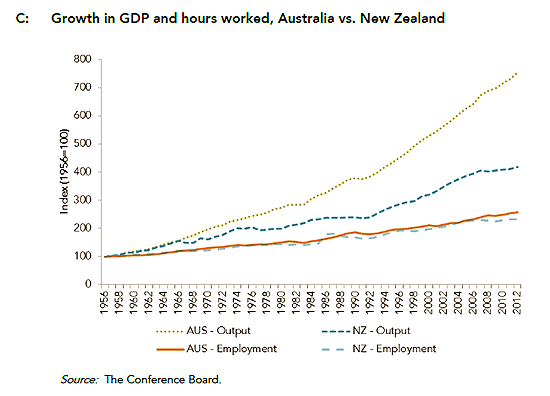
In other words, labour productivity in Australia has grown considerably faster than in New Zealand over a long period of time. This has been a key driver of the increasing income disparity across the two trans-Tasman economies.
Differences in industry mix explain a sizeable share of the trans-Tasman productivity gap, with Australia having a greater share of employment in high-productivity industries.
However, even within the same industries, New Zealand’s productivity lags Australia over most of the economy.
Indeed, across a broader set of countries, the available evidence indicates that the productivity performance of most New Zealand industries does not compare well internationally.
What next?
- This paper provides important information on New Zealand’s productivity performance. It is relevant for upcoming research and inquiries carried out by the Commission and its Productivity Hub partners.1
- The Commission is currently undertaking industry-level productivity analysis on: the industry contributions to the 2000s productivity growth slowdown, the contribution of labour reallocation to aggregate productivity growth and the shares of income going to labour and capital.
- In early 2014, the Commission will publish a productivity outcomes monitoring report (a series that the Commission will publish periodically).
Note:
1. The Productivity Hub is a cross-agency initiative that combines the productivity research efforts of a number of government agencies including: the Ministry of Business, Innovation and Employment; Statistics New Zealand; the Treasury; the Reserve Bank of New Zealand; the Ministry of Primary Industries; the Ministry of Foreign Affairs and Trade and the Productivity Commission.
---------------------------------------------------------------------------------------------------------------
The full 54 page paper is on the Productivity Commission website, or can be accessed here.

We welcome your comments below. If you are not already registered, please register to comment
Remember we welcome robust, respectful and insightful debate. We don't welcome abusive or defamatory comments and will de-register those repeatedly making such comments. Our current comment policy is here.