

Workers on median incomes are making real gains in their pay, but the income levels are rather low and the pace of these gains is slowing.
The basis of our KiwiSaver analysis, and our housing affordability analysis, starts with income levels. We have been tracking this data for a long time now.
Most political conversations about wage increases just deal with pay increases at the most broad level, overall for all workers. The latest QES release from Statistics NZ showed that full time earnings rose +1.7% in the year to June. This is a mish-mash of everyone.
But individually, we know that your pay rises as you age and gain more experience. Workers change jobs for higher pay. They seek new skills and experience and get [some] compensation benefits for these new attributes.
And after your late 30s, pay rises start slowing; your skills are close to their maximum and your desire and ability to change jobs decreases. But sometimes mobility is forced on you, and that may actually mean you go backwards somewhat in the pay stakes, especially if your skills are no longer as up-to-date as what employers want or need.
In addition, you may seek fewer working hours as you age; at least, you are not as keen on overtime. In some cases you may switch jobs from one with a heavy manual basis to one less physically demanding. These are common changes. And your income may reflect these changes.
The IRD collects pay details when employers pay their DED (PAYE) transfers. This data, by age, by gender, by region, is anonomised and published by Statistics NZ in the LEEDs series (Linked Employer Employee Data series). It does not cover everyone (not everyone is an employee), but it is a huge sample, probably exceeding 80% of the workforce. As such, it is a much more comprehensive set of data than the Quarterly Employment Survey (QES).
From this we can track median incomes, over time.
And we can see the impact of pay as workers age - what benefits they get from upskilling, what they lose as their skills atrophy and change to more sedentary roles.
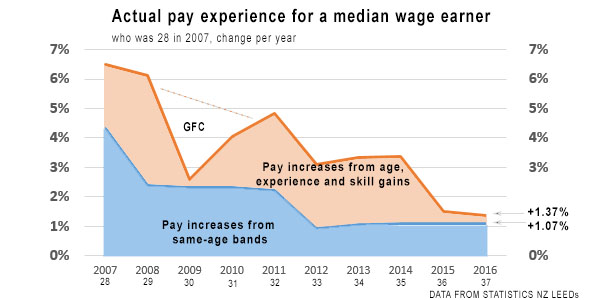
In addition, we can see a compound impact of the business cycle - in this case, how the GFC may have affected income growth.
And as we are taking about a decade view, we can deduct CPI inflation to get a sense of the 'real' change - is inflation eating pay gains or are actual gains still being made?
This is what the data shows:
| Year | Age | Median, pa | change | change | change for same age |
change due to age rise |
| (nominal) | (nominal) | (real) | (nominal) | (nominal) | ||
| # | $ | % | % | % | % | |
| 2007 | 28 | 42,276 | +6.5 | +4.4 | +4.3 | +2.2 |
| 2008 | 29 | 44,862 | +6.1 | +2.0 | +2.4 | +3.7 |
| 2009 | 30 | 46,020 | +2.6 | +0.7 | +2.3 | +0.3 |
| 2010 | 31 | 47,876 | +4.0 | +2.3 | +2.3 | +1.7 |
| 2011 | 32 | 50,190 | +4.8 | -0.4 | +2.2 | +2.6 |
| 2012 | 33 | 51,742 | +3.1 | +2.1 | +0.9 | +2.2 |
| 2013 | 34 | 53,462 | +3.3 | +2.6 | +1.1 | +2.3 |
| 2014 | 35 | 55,264 | +3.4 | +1.7 | +1.1 | +2.3 |
| 2015 | 36 | 56,085 | +1.5 | +1.0 | +1.1 | +0.4 |
| 2016 | 37 | 56,856 | +1.4 | +1.0 | +1.1 | +0.3 |
| Change over 10 yrs | +17,165 | +43.2 | +18.9 | +23.8 | +19.4 | |
| Change over last 5 yrs | +6,667 | +13.3 | +8.8 | +7.1 | +6.2 | |
| SOURCES: Median pay from Stats NZ LEEDs, CPI deflator from RBNZ Inflation calculator | ||||||
Note: this perspective does not separate pay by gender. Male medians are higher than female medians, especially as age rises.
My colleague Craig Simpson will look at the implications of this data from a KiwiSaver, retirement savings point of view in a separate article.
But the figures above show a number of trends.
Firstly, median pay levels are not high. At these levels (about $27.30/hour) it is very hard to save meaningful amounts.
Secondly, while inflation has fallen, 'real' income growth has fallen too to a modest +1% pa. True, it's not going backwards as median earners in many other developed counties have experienced, but to be fair, they started at higher rates of pay.
Thirdly, the GFC has had a very noticeable impact on wage growth. But it did not have any noticeable impact on pay gains due to rising age, experience and skill levels.
But when our benchmark worker passed into their late 30s, those skill and experience gains all but evaporated, leaving them with just the modest annual increases for their age band.
This data is for a median person. Remember, half the employees in this huge sample will have done better, half half will have done worse.
The other thing to remember is that this data is 'before tax' and before family tax credits (WfF).
Income tax rates can have an important role to pay in determining take-home pay.
In 2007, the median income earner would have had a marginal tax rate of 33c in the dollar and be in the 10% of taxpayers who paid 12% of all individual income tax. This median earner took home 79.1% of their gross pay in their hand (ie $33,455 in 2007 dollars).
In 2016, the median income earner would has a marginal tax rate of 30c in the dollar and is in the 7% of taxpayers who pay 8% of the individual income tax. Today, a median earner takes home 82.3% of their gross pay in their hand (ie $46,779 in 2016 dollars).
So lower income tax rates have added +3.2% to take-home pay over the ten years of this review. In 2016, that equates to $1,819 dollars.
Of course, the 'bargain' for some of these tax cuts was a rise in the GST from 12.5% to 15% which happened in mid 2010. Assuming all income is now spent on purchases that incur GST (which is probably unlikely but is the most aggressive assumption), that means that today's median earner is paying $1,421 more in GST than in 2007. The 'bargain' has been maintained with the income tax benefit ($1,819) being more than the maximum extra GST cost ($1,421). However, the net benefit of just under $400 per year is unlikely to be much assistance in saving for a house deposit or bulking up a retirement plan. The bottom line is that income-tax cuts and GST rate increases don't really change the picture we see when we just review the data at 'gross income' levels.
We welcome your comments below. If you are not already registered, please register to comment
Remember we welcome robust, respectful and insightful debate. We don't welcome abusive or defamatory comments and will de-register those repeatedly making such comments. Our current comment policy is here.