

We are near wrapping up another year - and for most of us it has been a good one - so now is the time to assess whether we are better off than at the start of 2018.
That is a big assessment, and everyone will have an individual take on it.
It also includes many non-economic aspects, some arguably more important than the economic ones.
But this review is focusing only on the economic dimension, and only on a broad, national overview.
Fortunately there has been some recent data updated to September that can start the discussion. Although it is not due until next week, the Q3 2018 GDP will add to three quarters of data already known, and estimates will vary only in a minor way when the final Q3 data is released. With this data and the recently released C21 household income data, we can update the relationship between the two.
Essentially, this tests how much of the country's overall national income is earned by its households.
And the share is a stable 60%, a level we have averaged since 2014.
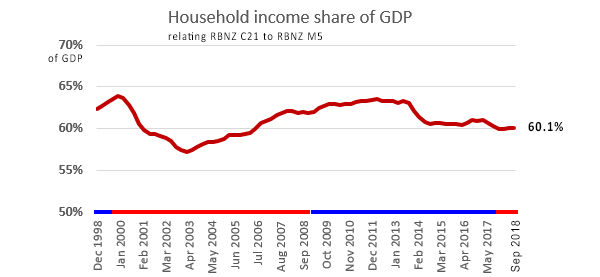
From 2008 to 2013 it averaged 63% and then fell back after an unusually strong export-boosted economic growth spurt.
In the period 2000 to 2003 it was household incomes that grew very weakly and did so at a time nominal GDP growth was strong. This was not a period when CPI inflation was unusual, although income tax rates were high suppressing overall incomes. This is the period when New Zealand households discovered the magic of capital gains that could be accessed by 'investing' in residential rentals to weigh against the high income tax rates.
Then the question arises, is this income being captured in an unequal way? The latest MSD analysis suggests not.

Essentially, New Zealand's Gini index of inequality has remained lower than most other OECD countries and scored in the low 0.30 - 0.35 range for about 25+ years. It isn't worsening.
Therefore, the proposition is that most household's are accessing a fair share of the national income, and that inequality isn't worsening from a level that is good by OECD standards.
Yes, it has been another good year, one worth celebrating. WDKHLWA
98 Comments
Great article thanks, nothing like common sense and facts to paint an accurate picture !
The irony being - where does Fred Dagg live these days!
John Clarke doesn't live anywhere anymore.
John Clarke is R.I.P. sadly.
There are also fewer people working longer hours so that must count for something as well.
“Yes, it has been another good year, one worth celebrating.” Couldn’t agree more.
But this site is infested with pessimists, and the only thing that can make a doomie more gloomie is good news.
BLSH,
Despite being in bed with a disc problem,I have had a good year and I am pleased that income inequality is not rising. There is much to celebrate,but your view is somewhat Panglossian.
Try telling it to those queuing at Foodbanks,to all those forced to live in damp,uninsulated properties. What about the long and continuing disgrace of our thousands of shoddily built new homes and schools,our rotting hospitals. What about our youth suicide rate,domestic abuse,polluted waterways,lack of infrastructure and so on.
You need to take off your rose-tinted glasses and look around.
Some interesting results on inequality and distribution of incomes. One of the interesting results is the increase in income inequality from the various law reforms at the start of the 1990s.
"This is the period when New Zealand households discovered the magic of capital gains that could be accessed by 'investing' in residential rentals to weigh against the high income tax rates."
DC, are you talking about the Cullen rich pricks tax? From memory at that time it was mainly rich pricks paying it, not typical NZ households...
The top tax bracket kicked in at 60K. It was horrendously low and they only got away with it because property values climbed and everyone was feeling too rich to notice Cullen with his hands in their wallets. He didn't care that people could earn more money and pay less tax in Australia and is on record in Parliament as basically saying "good riddance".
60k then is worth 90k now. So I guess it wasn't just the rich but not exactly the average household.
What happened between 1989 and 1991 to so dramatically change our Gini coefficient? We went from enlightened egalitarianism to Oriental despotism seemingly overnight.
I remember this period as a time I went from very low wages to not too bad. Others must have been left behind. I work in IT and we transitioned from mechanical office equipment to electronics in a major way during this time.
Both the building act and resource management act were introduced. They came into full effect later. There were most likely a number of other changes (of which I can't remember all of them).
We also hit peak unemployment at around 11% at about 1990/91. High employment doesn't really help improve equality for the labour market.
Employment contracts act and the sale of SOEs.
We felt the full effect of the Lange-Clarke Labour Govt; pure and simple
What happened between 1989 and 1991 to so dramatically change our Gini coefficient? We went from enlightened egalitarianism to Oriental despotism seemingly overnight
The result of Rogernomics and "free market" theories.
The RMA didn't take effect until halfway through 91 and won't be the cause.
More interested in where households are going after deducting the minimum cost of living. Are household discretionary incomes improving, or are increases in minimum cost of living increasing faster than take home wages?
Rates, mortgages/rent, insurances, fuel/transport costs all seem to have increased markedly over the last few years, are they soaking up a greater percentage of post tax wages or not?
I think its pretty obvious that with the rate of wages not increasing at the same rate as all the other costs, things are getting worse for most people. Things are getting better ? tell that to people living in their cars. There are those that think things are getting better because the latest big screen TV has come down in price. Sure I'm all right Jack, got money in the bank but I see people struggling to make ends meet. What the city mission request for food is up 25% this year ? You can come up with all the numbers and graphs you like but the voice from the street both here and in Paris tells another story.
Although I think average wage increases are a fair amount higher than CPI inflation (which is the price increase of a typical household's goods).
I think that you will find that things are relative. Those living in cars have probably experienced a corresponding lift in standards. Before it was a rusty Holden Commodore while now it is a comfy Toyota Estima with better fuel efficiency and improved creature comforts.
I reckon Macron would probably have said things similar to the French - "look the graphs say it's all fine. France is pretty equal in OECD terms... what are you moaning about?"
As one Yellow Vest said - "we are sharpening the guillotine but we are not sure if there is one big enough for Macron's head."
Working class and middle-class NZ'ers will eventually get pissed - they don't want crumbs either - "they want the whole baugette" too. Or at least a bloody wholegrain loaf once in a while rather than a $1 refined loaf of crap.
The yellow vesters were mainly complaining about petrol prices weren't they? Do they feel stupid now (much like most NZers should) that petrol prices have dropped significantly with crude oil prices (which Macron doesn't have much influence on)?
Um, Jimbo, the Yellow Vests have just extracted the following things from Macron - a 100 euro rise in the minimum wage, a cut on pension taxes, an end to the new diesel tax, no tax on overtime and he has implored businesses to give out Christmas bonuses. But the Yellow Vests are not happy with the crumbs. "They want the whole baguette!" This protest is about much much more than the diesel tax. It has morphed into something much much bigger threatening Macron's whole technocratic centrist project. Get thee to France 24 English and watch some of the coverage.
But how is that sustainable? Why not increase minimum wage by a million dollars and reduce all taxes to 0? Is it realistic for the government to continually borrow to pay people's day to day living? French government debt to GDP already at 100% - how long before their lenders dry up?
its not
https://medium.com/insurge-intelligence/brexit-stage-one-in-europes-slo…
"The energy turning point is unequivocal. In the years preceding the historic Brexit referendum, and the marked resurgence of nationalist, populist and far-right movements across Europe, the entire continent has faced a quietly brewing energy crisis.
Europe is now a ‘post-peak oil’ continent. Currently, every single major oil producer in Western Europe is in decline."
https://www.youtube.com/watch?v=hM2QLAP5too
good link to what's going on in France
Jimbo, please give me a little credit re the minimum wage and reducing all taxes to 0. Taxes create demand for the currency for goodness sake.
It's might well be reasonable for governments to deficit spend to offset leakages in demand to savings, taxation and imports given capacity underutilsation and idle labour. The limit being inflation. That is functional finance.
Lenders can dry up if you're in the eurozone. But the ECB will have to do whatever it takes for France - it's that or it breaks up.
Wow, Carlos and I agree on something.
Add in historic long term changes in things like tertiary education costs going from nearly 100% state funded to now a significant portion being charged via student fees, part charges on medical treatment, GST etc and i'm not really sure the workers are taking home more of the wealth. Our quality of life is increasing, but that mostly from improvements in technology/knowledge.
It certainly seems to me that the bottom end of the "effective" income curve is rising slowly, while those at the top end of the curve are rocketing ahead. I'd prefer to see it a bit more even.
Agree with the income curve. Unfortunately I think with technology it is inevitable that the demand for highly skilled workers will increase more than the demand for lower skilled workers. The harsh reality is that people will need to up-skill or see their quality of life diminish. Which is why I am very much in favour of Labours free tertiary education programme.
Tell that to professionals trying to save for house deposits. Not only has immigration driven the prices of the houses up, it's also suppressed wages because 'skilled' migrants permanently top up the supply of labour.
Although the unemployment rate is pretty low so I'm not sure immigration would be driving labour costs down much.
" Never mind the statistics .. they are all wrong. Why ? because I know better".
The statistics might be correct.. but the results drawn from them wrong. If your pay went up, but more costs got added to your costs of living have you gone forward or backwards?
Out of touch , not in real world I'd say.
I know people living in crowded 2 bedroom houses, earning $1000/week as a couple doing long hours paying $500 in rent. So yes some who have the right skills in this Digital age are doing well, but there are older folks who are in the verge of loosing their jobs because the skills are either no longer relevant or getting made redundant . They cant simple upskill without any support.
Its a sad indictment when the gap is getting bigger. Corporates want young , digital savvy kids and old ones are cast aside. Welcome to the new world.
Quite ironical considering its the millenniums who complain about house prices- well atleast they will have food at the table.
It's also ironic that it's typically the older generations that inhabit the tops of these corporations, I guess it further reinforces the stereotypes around the older generations and their psychopathic traits. Lay off their peers in favor of young blood who can be molded to extract maximum profit while keeping the wage bill minimal.
The older folks have had plenty long enough to upskill and buy a house at a fair price. Millenials on the other hand are often entering the workforce with a 10% cut to pay for a mandatory piece of paper if they want to work anywhere that isn't fast food or stacking cans.
Older generations will be facing Disruptive businesses like urber, air bnb etc .
times are changing so both generations fair to say will be facing the challenges.Lets not lay the blame game, but work together
Great to see some evidence-based analysis, David.
It is worth pointing out that the labour share of income in NZ is quite low by OECD standards, and of course measures of inequality do not tell us the extent to which absolute levels of household income have changed over time.
"Therefore, the proposition is that most household's are accessing a fair share of the national income, and that inequality isn't worsening from a level that is good by OECD standards."
My friends and I must be deluded then we complain to each other about being squeezed, having to work longer and taking on more debt or admitting a trip to the local foodbank. Great solace such figures provide. Everything is actually fine. It's all in our head.
I'm kind of like Carlos, above, where I am a little sceptical. David says"It is stable at a good level." Is it really a "good" level or have we just become accustomed to it? To me this smells a little too much like smoke and mirrors. It feels like David has found a set of figures to support a particular paradigm.
I feel that the evidence on the street is that the equity gap is widenin, as more people are struggling to afford a roof over their head. All the strikes we are getting lately reinforce this perspective as people are saying that, percentage wise the ordinary workers are falling backwards. Look at nurses, the lions share of their settlement goes to senior nurses at the top of the pay scale. this is true for other settlements too. Managers always seem to be first at the trough, and rest get the scraps. The AirNZ strike, despite the publicity being put out by management, seems to be saying that senior management at the company are getting significant rises and/or bonuses, but the largely invisible masses that make the company work get barely cost of living or less in their wage rounds. Sure a few do get good money, but what about the majority of them? Capital gains on your house does not put food on the table, pay the utility bills or gas and tyres on your car. If you're renting it is even worse.
The Utopians these days are not the socialists or the neo-fascists or the populists. They are the technocratic centre that say things can go on as they have been for the last 30 years. Everything's fine. La la la (fingers in ears).
Inequality is such a hard thing to measure IMO. But I can remember back to the 90's when many people I knew (including us) had little more than a house (rented or mortgage), food (mince on toast etc), a landline, one car and one TV. No heaters (just blankets or fireplace), no devices or phones, no eating out (McDonalds was a once a year treat), no sky TV, no air conditioning, no entertainment, no holidays, kids had very few toys, etc. So I'm not convinced life has got worse for the majority people. I do think the cost of housing is the big difference. At least in the 90's most people seemed to be able to afford a roof over their head. Also the fact that most households have two incomes has made life very hard for those with only one.
Guess what - down my street there are a lot of families that can't afford mince on toast - noodles only, have no car and heaters they can't afford to run. No holidays. No swimming lessons for the kids. And no housing security. They live in conditions that look like Soweto. Things are worse in NZ than the 1990s - despite the phone and the flat screen tv and the maccers - the latter are their to keep them docile and impoverish them further most likely - and give them metabolic disease. You are out of touch my friend.
If you live in a relatively well off area you are psychologically and physically insulated from feeling the misery of the very poor sector of society; but as a taxpayer you are not fiscally insulated from the costs due to the associated disease, crime and drug use.
The Q is, what is the fix: is there a fix?
Breaking up the supermarket monopoly would be a good start. Yesterday I saw a very stressed couple at the supermarket arguing about their bill. The CPI is bull*. It's not an apples to apples measure. The most basic items like meat and veg are a huge ripoff but if the cost of junk food or luxury cars drops are those people really better off? It's a very muddy statistic with a lot of things mixed in. Frankly the BigMac index might be more accurate.
The fix consists of two parts. Short and long term.
In the short term dealing with the existing problem areas - which are being addressed as they always have for the bottom of society. But what can you do for a woman with 8 children and no partner or income - just more of the same. .For these situations little can be done
I am very skeptical of using data showing demand for food parcels increasing - when if you state more accurately demand for free food parcels is increasing - should that come as a surprise ?
In the longer term - we just have to address the removal of incentives to have more children. Show me a family with a single parent and a large brood and in almost every case I will show you poverty.
Today the difference between getting a job and another child is basically zero.
As Mankiw - Macro Economics states - one of the first laws of economics " Individuals respond to incentives - including the poor "
Increasing benefits has the perverse outcome of just locking beneficiaries into a life of disadvantage.
In the words of John Key some 10 years ago - We are breeding an underclass.
Without structural changes tp our benefits system - we will be having this conversation into the never never as todays longer term problems become tomorrows short term problems ad infinitum.
I was replying to "percentage wise the ordinary workers are falling backwards". Not saying that it isn't happening, just that anecdotally I don't see that.
But as I said, high house prices (e.g. rent being $400 a week min in Auckland) are a real problem for many people - such as someone on minimum wage earning less than $600 a week.
You must be from the same generation as me. I used to hire a B&W TV and would buy a single pork chop as a special treat.
Maybe your family and the community you grew up in were considered poor? Like bottom 10%?
...my dad used to get the broken biscuits form the local factory, he would take dirty hankies off the street for boiling and washing, ate rabbit, can no longer eat pumpkin. Tough life as a kid.....but listening to him, not poor when I see how many families are now. They lack optimism and hope. I think lack of 'hope' that life can get better is the real test of 'poor'
Those were pretty common conditions for most people in small towns in New Zealand.
I think people forget how incredibly expensive a 20" TV was in those days. It was a major expense. Being able to afford a VCR was pretty fancy.
Poorish - maybe bottom 30%. And maybe it was actually the 80's not 90's.
Here's something interesting I've just found out, regarding the cost of consumer goods, in respect to this article:
Using the Big Mac Index instead of the (dubious) CPI inflation, a Big Mac cost New Zealanders $2.95 in 1995 - compared with $6.20 today.
Now, that's an 110% increase in the price of a Big Mac in 23 years - or 4.78% year-on-year on an annualised basis.
That's a lot of inflation! This flies in the face of CPI Inflation numbers, which are obviously much lower than 4.78%.
So, if your household income is not going up by 4.78% per year (which the statistical information in this article suggests it isn't) - you are losing significant purchasing power.
Food for thought, and a small window of insight into the collapse of the middle class.
but of course you do not have to do it based on Big Mac price ; you could have also picked the cost of 30 inch TV as your benchmark item and the results would be just a bit different ...
Maybe we could talk about cost comparisons on things that matter like milk, bread, housing and petrol.
Look at the price of a Bitcoin today compared to last year, we’ve got it so much easier these days.
The CPI is based on what the average household spends its money on. It includes things like milk, petrol and housing.
There's a bit of a problem using average household spending here. I think CPI would be much more useful for policy setting if it was broken down to household income bands. The lower income households certainly won't have the same average basket of goods as the top 10% of households. Living staples go up? Luxury electronics, overseas holidays and travel get a bit cheaper? A divergence in CPI over time for different households. And yet CPI as a whole is used for example to adjust benefits etc.
This is why stats nz introduced the household living costs index. It does show the variations in inflation for different sectors of society. One of the things that has helped higher income earners is the reduction in interest rates. Not much help to pensioners or renters in general.
https://www.stats.govt.nz/information-releases/household-living-costs-p…
What it doesn't measure is when people switch to a more watery brand of milk, switch their 95 octane sports car to a 91 octane economy box and build houses out of ticky tack pine needles and tin instead of remu and tiles. The CPI takes none of the quality into account.
Good way of putting it. Last year I never would have dreamed of being able to own a bitcoin. Seems like a much more tangible goal to aim for today.
At least colour tvs are cheap enough that if you can’t afford to pay for a roof over your head you can sleep under a 42 inch Sony Bravia.
I don’t know how we did it in the 90s when a TV was over $6000 in today’s money.
Stole the cardboard box the rich buggers tv came in?
Don't need to do that! Winz will give out a grant for an actual TV.
Half agreeing with his point about dryer being more important than a TV.. simultaneously cringing at "family of 7". Does winz give grants for getting the snip?
I am not even going to mention smoking.
Lets not talk about the price of milk ! who here can remember putting out the bottles in a crate and stacking 2 cent pieces on top of them ? one for each bottle and that was the price delivered to your letterbox in the 70's.
Milk and bread was subsidized by the government in those days.
I'm going to have to see the evidence on that one. If my memory is reliable it was the opposite, protectionist practices meant no competition, so prices were whatever the limited number of producers charged.
The govt took control of milk pricing in the 1940's. The wholesale and retail price of milk was set by the government - 1968. http://www.nzlii.org/nz/legis/num_reg/mpn1968147/
Increased in 1978 http://www.legislation.govt.nz/regulation/public/1978/0123/1.0/whole.ht…
The governance of the sector remained in accordance with the policy negotiated between the state and the industry's leadership with the government retaining overall power through its control of price determination. During the protracted negotiations prior to the deregulation of the liquid milk sector in the 1980s,... pg 87 of
HISTORY OF THE NEW ZEALAND MILK BOARD
A STUDY OF THE CORPORATIST ALLIANCE BETWEEN
THE STATE AND THE DOMESTIC MILK SECTOR (you may need to google it)
You are mistaken
Home delivered milk in the 1970's was 20 cents per bottle not 2 cents
In 1985 I was making about $20K a year gross.
After much ferreting around I purchased a 14inch 'portable' tv for 1080 dollars. More than 5% of my gross income. I was very happy at the good deal I had found.
1. No, its 3.28% on an annualized basis.
2. Looking at inflation in one product and then generalising in misleading. CPI is based on a basket of goods and services, and includes things like electronics that have declined in price substantially, and other things like rent that have increased a lot.
3.Was a Big Mac 2.95$ in 1995? I seem to recall it was in the region of 4.95$. But perhaps I have forgotten.
The 'Big Mac Index' uses a Big Mac as a measure of reference because it actually contains a basket of goods and services within it (labour costs, transportation, commodities) across a business that does not inflate its prices, as its market position as a low-end food chain.
It's also measurable across multiple countries. Because of this, using it as a measure for inflation and currency valuation - while admittedly being tongue-in-cheek - is surprisingly effective.
It was - at least, according to a NewsHub article I read. Here's the source:
https://www.newshub.co.nz/business/what-things-cost--then-and-now-20110…
Yes but your original claim that it represents a rise of 4.78% pa compound is incorrect, it is 3.28% pa compound which is much closer to the yearly wage increase over the last 23 years and therefore it voids your claim that we are far worse off today
Big Macs cost $3 today. You just need to the the maccas app. In 1995 it was not standard practice to inflate the price of goods and then discount them. These days you need an AA card to get fuel which is always at least 4 cents per litre off and you need a OneCard to get discounts at the supermarket.
Here's the missing piece of the puzzle: How many adult hours per week are going into the 'household income'?
If one income was capturing 60% in 1980 but now it's 2 full time adults working to capture the same share of income then it's halved, not stayed stable.
This is also something many people fail to understand when they look at housing affordability and median household incomes from previous generations and compare them to modern dual income professional households.
This theory could support the gradual reduction in unemployment rates from the late 80s/90s to today? More and more households taking up more jobs (going from 1 to 2 working adults or multiple jobs) to maintain the "share" of the pie?
From the Stats NZ website:
"Unemployment is defined as being without paid work, where a person was available for and actively seeking work."
So the stay at home wife getting a job doesn't affect the unemployment rate, so long as nobody else lost their job when she got one.
The unemployment rate seems a bit open to interpretation (manipulation) in my opinion. How exactly do they know who is looking for work? How active do you need to be? Do they phone poll?
Moot point anyway, apparently Stats NZ are no longer tracking the unemployment rate anyway. Moving towards "well-being" indicators instead.
That's a valid point. I'd be interested to hear what the author thinks about it.
"Essentially, New Zealand's Gini index of inequality has remained lower than most other OECD countries and scored in the low 0.30 - 0.35 range for about 25+ years. It isn't worsening."
Well, that nails another lefty myth about the 2008-2017 National government.
FWIW, the MSD's Bryan Perry has been doing this research for years and he has been a trusted advisor for both shades of government.
And yet somehow National weren't returned to govern and we now have collectives going for industrial action. I guess the nurses, teachers and who ever next are just downright greedy.
and yet, somehow the guy who got 7% of the vote ended up appointing the government on the basis of being given a $3 billion slush fund, back downs on the world's biggest marine sanctuary and monitoring of the fishing fleet, and money for rich blokes to have an all weather racing track and for good looking horses.
btw, Nats in 2017 got pretty much the same vote as they did in '08, '11 and '14 - and a larger percentage than H1 ever did.
Umm, who is getting the other 40%? Shouldn't a nation of households receive 100% of it's national income?
What constitutes a household?
5% of that went to the banks as profits.
Not if your account is good. It ends up in a trust. Also overseas investors/and financiers want their pound of flesh too as Nzdan mentions.
The company I work for was prior owned by a Multinational Corporate, I've seen first hand how that pound of flesh has more might than the benefits of the people who actually generate that flesh. We're now owned by a 100 year old NZ company but I'm in a shared office with an American Corporate with a head office in Dublin, the differences are chalk and cheese.
Just recently they had their propaganda posters turn up talking about "double it up". Double production, Double efficiency and Double EBIDTA. They don't get bonuses, they rarely get pay rises, they don't have drinks on a Friday afternoon, they're understaffed and underpaid.
Hmmmm
According to the OECD
http://www.oecd.org/social/income-distribution-database.htm
The average gini coefficient in the OECD in 2016 or the latest year available was 0.318.
According to this source NZ was 0.349. This is the 6th highest in the OECD, out of the 36 member countries. The good company we keep:
Mexico, Chile, Turkey, United States, United Kingdom, New Zealand.
OECD data also suggest we have the second lowest taxes on labour income (as a fraction of GDP) in the OECD (this includes income taxes plus social security contributions), although we do collect more taxes on business income than other OECD countries. Fortunately, as the Tax Working Group likes to point out, our imputation system means that very rich people pay the 6th lowest taxes on business income paid out as dividend income in the OECD. (Unfortunately this does not mean that average New Zealanders pay the sixth least taxes on dividend income when compared to average people in other countries, however: it is reflection that high income New Zealanders face very low top marginal tax rates by OECD standards. It also ignores the tax advantages people in other countries get because they tax retirment savings on an expenditure basis).
It so happens we have a tax system designed by high income bureaucrats and politicians that favours high income bureaucrats and politicians, without leading to much redistribution by OECD standards. If you read the Tax working Group Interim report, there are not many plans to alter this situation.
Yes I don't know why you'd think NZ had a 'good' gini coefficient? One of the worse ones...how do you claim it is "lower than most"?
The Gini coefficient doesn't mean much by itself. Bangladesh has a "better" coefficient than NZ but that doesn't mean it is a better place for poor people to live, far from it. If you have a per capita GDP twenty times greater than a country that has a better Gini you probably have a better country to live in, especially if you are poor.
Also I am intrigued by your claim that we have places that resemble Soweto. Can you tell us the location so we can check the streetview?
I take your point. I shouldn't over exaggerate to make my point. Mea culpa. No it's not the desperate absolute dirt floor poverty of 80s Soweto. But it's a neighborhood in decay where people's living standards are not what we should tolerate in NZ if we are to be a decent society.
Here we go Zack, random street in Soweto. Easily comparable to a lot of NZ - except the houses are better built, nice brick walls and fences.
I seem to remember the early 80’s as high unemployment of 11%, and high mortgage interest rates, 18%, with large mortgages as there had been sudden house price rises in about 1974.
Not easy really.
The we had a brawl with the French (Rainbow Warrior) and that cheered us all up.
Yeah, 18% interest rates for like 2 years.....The mortgages wouldn't have been large compared to today, and inflation was huge between 1974 and 1988. That would have been great for anyone taking out a mortgage in the late 70s to have inflation eat away at the debt burden. Anyone saving would have had 10%+ deposit interest rates as well...
Between 1971 and 1988 inflation fell below 10% in only 4 out of 17 years, and exceeded 15% in 5 years.
We had a brawl amongst ourselves when the Springboks came.
Oh it must have been awful buying your house on a 1/2 acre section at 3x income. Terrible. My heart goes out to the boomers.
Im not a boomer, but bought a house in Onehunga on 430m2 for 123k in the 90s (cant remember the year). This was roughly 4x Now apparently that house is "worth" 1.1m which is roughly 8x
Dp
I don’t remember inflation being all that welcome and Robert Muldoon instigated a wage freeze.
Would that help?
Oh, and house prices were flat for a decade in spite of inflation..
And her majesties government threw its dominions to the wolves in 75.
Not that I’m being dramatic.
So where is the simple bell graph that shows the proportion against out the countries total wage/ salary/ bonus bill?
Going from say 1965 thru to today?
Comparing the TOTAL population share of GDP means squat.
"The myth is that households are getting less and less of the national income."
It is NOT the share of the the NATIONAL income that ids the problem... it is the middle 50% of the population, the teachers, midwives, the clerks, the engineers... the people targeted by kiwibuild and cant afford to by..the people who are currently on 50 or 75% of the wages of a basic MP, where as a couple decades ago where about the same..
The people who are starting to dig there toes in..and not for some random reason.
Stats can be made to give the impression of anything one would like...but the reactions within a society, the symptoms of "unaffordable" when the real problem is the middle 50% who a growing GDP depends on, just no longer get the income to sustain that gdp without substantial immigration.
We welcome your comments below. If you are not already registered, please register to comment
Remember we welcome robust, respectful and insightful debate. We don't welcome abusive or defamatory comments and will de-register those repeatedly making such comments. Our current comment policy is here.