
I like chart porn.
This is where I look at a collection of charts that help explain how the economy and government operates.
If I look long enough and hard enough I can get very excited.
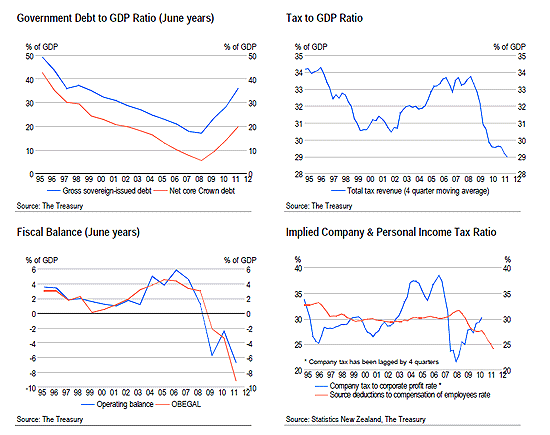
But looking long enough and hard enough at these four charts from Treasury's Monthly Economic Indicators chart pack just made me exasperated and angry.
It showed how irresponsible John Key's government has become in the pursuit of pleasing its increasingly wealthy backers, who are the owners of property and the earners of high incomes.
It is clear now that John Key's government has effectively cut the income tax rate and paid for it by borrowing money overseas, in large part from China's sovereign wealth fund. It is ultimately an act of economic treason and generational selfishness where a govenrment has decided an already wealthy part of the population deserves higher incomes paid for by loading up foreign debt on future generations of taxpayers and voters.
It is an act of cynicism and short termism that deserves contempt.
The four charts show what has happened since 2008. They reveal the results of the cut in the income tax cut rate from 39 cents to 33 cents, which was in theory partly paid for by an increase in the GST rate from 12.5% to 15%. They also reveal a massive reversal in a decade-long trend of improvement in New Zealand's public debt position.
New Zealand's tax to GDP ratio has crashed from almost 34% in late 2008 to 29% in 2011.
At the same time, the 'source deductions to compensation of employees rate' has fallen from around 32% to around 24%.
This is a direct result of the cut in the top personal tax rate and a change in the way New Zealanders are spending. Many are saving more rather than spending their incomes.
That is a good thing in the long run, but it means the higher GST rate is not collecting the revenue expected under the 'tax switch'.
Instead, the government is borrowing money to make up the difference. At the same time, interest free student loans and Working For Families are deepening budget deficits (operating balance and OBEGAL).
That is being paid for with increased government borrowing to the tune of 15% of GDP.
A collapse in the corporate tax take is only partly responsible and is largely due to the recession rather than any change in government policy. It is now rebounding, but if anything the Tax to GDP ratio is worsening.
This is unsustainable without an immediate and extended surge to economic growth, which few expect.
Why are voters who will have to repay this debt in decades to come not revolting at this national act of selfishness and irresponsibility?
Have another look at these four charts to understand why the government's settings on tax, universal superannuation, the retirement, un-means tested healthcare, Working for Families and Interest free student loans are unsustainable.
This story first appeared in the Herald on Sunday
We welcome your comments below. If you are not already registered, please register to comment
Remember we welcome robust, respectful and insightful debate. We don't welcome abusive or defamatory comments and will de-register those repeatedly making such comments. Our current comment policy is here.