This article was first published on AUT's Briefing Papers series. It is here with permission.
By Natalie Jackson*

Auckland accounted for over half of this growth, while the remaining growth was unevenly distributed across the rest of the country.
Between 1996 and 2013, Auckland and the three other fastest growing cities (Tauranga, Hamilton and Wellington) shared two-thirds of the growth, while Auckland and just 13 of the total 67 territorial local authority areas (TA’s) accounted for over 90 per cent, leaving a bare 10 per cent to be shared among the remaining 53 TA’s.
Of the latter, 22 declined in size across the period, a situation that for many rural areas will be permanent.
Currently, the primary cause of New Zealand’s rural depopulation is net migration loss primarily at young adult ages — the ‘old’ form of population decline. Increasingly, and with some imminence, migration-driven depopulation will be accompanied by the onset of natural decline, the end result of structural ageing that is ushering in more elderly than children and more deaths than births.
Together the trends will become self-reinforcing as this ‘new’ form of depopulation takes hold — already the case for Japan and much of Europe.
Over the next two decades we will see, with few exceptions, one TA after another reach the end of growth and, in most cases, shrink in size.
By 2043 around 44 TA’s are projected to be experiencing decline, by then affecting 22 per cent of New Zealand’s projected population of 5.6 million.
This situation is emerging because the developed world is now coming to the end of its 300-year long demographic transition, during which falling infant and child mortality rates initially caused populations to become more youthful and explode in size, as births increasingly exceeded deaths and natural increase soared, and then to grow structurally older, as more people lived longer, and birth rates fell — ushering in the end of natural growth. Ironically, natural increase has long been taken for granted, while migration has been widely and incorrectly assumed to be the primary cause of growth, even for Auckland.
Nationally, the decade 2004-2014 saw natural increase account for over 321,000 persons, while net international migration delivered just over 100,000.
The ending of population growth is preceded by shrinking workforces, first as a proportion of the total population, and then numerically. New Zealand has already passed its peak proportion at ‘prime’ workforce age (15-64 years), doing so between 2006 and 2011. This trend is now accelerating.
In 2013 there was, nationally, only eight people at labour market entry age (15-29 years) for every ten aged 55+ years, where, despite increased labour force participation at older ages, the ‘retirement zone’ looms. At subnational level two-thirds of New Zealand’s TA’s already had fewer people at labour market entry than exit age. By 2018 this situation is projected to be the case in 85 per cent of TA’s, and in 2023, in 90 per cent.
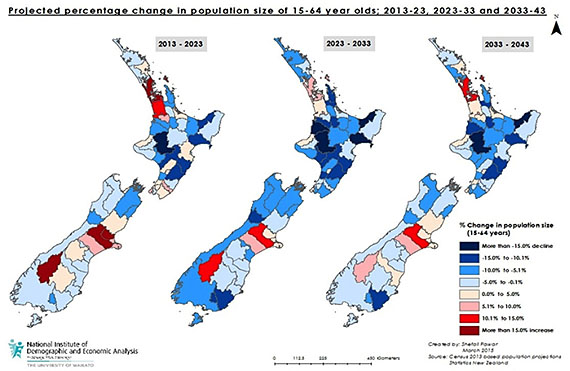
By 2043 there are projected to be around 444,000 more New Zealanders aged 15-64 years than in 2013, but 51 TA’s (76 per cent) are projected to have fewer. The accompanying map shows how the situation will approximately unfold.
The situation is already clearly evident in New Zealand’s employed workforce, where the entry: exit ratio in 2013 was below 0.9 (nine people at entry age per ten in the retirement zone), down from 27 per ten as recently as 1996.
This average conceals marked differences across industries and occupations.
New Zealand’s four largest industries had ratios of 0.4, 0.6, 0.5 and 0.9. As a general guide, all industries concerned with health, community care, teaching, grain/sheep/beef farming, horticulture, and transport have entry:exit ratios around 3-5 per 10; that is between 3 and 5 employed persons aged between 15-29 for every 10 employed aged 55+.
By contrast, several industries like retail, hospitality and computer services have relatively young age structures, but people are not perfect substitutes for each other and most lateral movements (eg, between occupations, between industries) involve related training.
As structural ageing progresses we can anticipate growing skill shortages and competition for labour at subnational level, as well as decreased unemployment (both already showing in New Zealand’s older regions) and this situation can further be expected to increase labour costs.
It is certainly the case that technological and industrial change will see the demise of some jobs, but equally certain that others will see increased demand, while capacity to physically — and fiscally — supply will diminish. The community care services workforce, for example, has doubled in size since 1996 and risen from 17th largest to 6th largest.
These inexorable trends are unlikely to be resolved in the medium to longer term by either international migration or an increase in the birth rate. The number of migrants required to offset structural ageing is simply too large, while competition for them is growing—across the 58 more developed countries (from which most skilled migrants are currently obtained) the population aged 0-64 is projected to be around 59 million smaller in 2038 than in 2013. It should also be remembered that migrants also grow old—over 30% of today’s older New Zealanders were born elsewhere.
Projected labour supply shortages are also unlikely to be resolved by a major increase in labour force participation at older ages; of OECD countries New Zealand already has the second highest employment rates at 50-64 years and the fourth highest at 65-69 years. Irrespective of likely increases in the length of the working life, there is an urgent need for a national workforce planning strategy, along with decentralisation and other related policy initiatives to slow — or at least manage — rural decline.
How are these issues being responded to in countries that are further advanced in terms of structural ageing and the ending of growth, such as Japan and many European countries? Research finds that policy interventions can be approximately divided into three groups: doing nothing; countering strategies; or accepting strategies.1
The ‘accepting’ strategies involve first acknowledging the likelihood of sustained depopulation, or at least, the ending of growth, and then managing the process while continuing to utilise opportunities such as natural advantage – and continuing to look for emerging opportunities. These countries/regions do not seek to keep population growth per segoing. Japan and Germany fit into this category.
Most countries are, at this point, developing the ‘countering’ type of strategies, which on the one hand seek to maintain competitiveness in the market (typically based on ‘old’ economic principles), and on the other, seek to connect previously disconnected sectors, such as industry and community groups, and government at all levels. The latter approaches prioritise collaboration rather than competition, and are thus to some extent in contradiction with the former.
Not many countries or regions can be clearly identified as ‘doing nothing’, but personal experience indicates that this is in fact the case for many subnational regions – and perhaps more importantly, for many agencies and organisations which are slow to accept that sustained population growth was never a given, and that decline will sooner or later be the case. Doing nothing essentially leaves the fate of towns and organisations to the market.
The overall message is that major demographic shifts are coming to a region near you.
There is little that can be done to alter the demographic future, but much that can be done to ensure policies are fit for purpose.
It is essential that regions, TA’s and organisations revisit their policies and plans and the principles on which they are based, to ensure they are appropriate for ageing populations – but also importantly, one within which there are markedly younger and older populations, such as Maori and European, each with different needs and opportunities.
Choice of strategy in how to engage with these trends and circumstances will very much determine whether regions, TA’s and organisations will be successful going forward.
Quality of life and attractiveness of place under the ‘new economy’ model will increasingly become key determinants for sustaining a population. This does not imply a return to past levels of population growth, but rather, the maintenance of locally-stable, resilient communities in a post-growth environment. Knowing the local drivers of demographic change and what can and can’t be achieved is a first vital step for those charged with providing services to engage with.
This research is part of a larger project supported by the Royal Society of New Zealand Marsden fund.
[1] McMillan, R. (2015) Anticipating Depopulation. Strategic Interventions to Population Decline. Masters Thesis currently under examination, University of Waikato.
Natalie Jackson is Director of Natalie Jackson Demographics Ltd and Adjunct Professor of Demography in the School of People, Environment and Planning at Massey University. Until recently she was Professor of Demography and Director of the National Institute of Demographic and Economic Analysis (NIDEA) at the University of Waikato.
This article was first published on AUT's Briefing Papers series. It is here with permission.
10 Comments
Regional decline is hastened by tight Govt fiscal policy. If regional schools, hospitals, roads, infrastructure, tertiary ed, etc were fully funded then NZs population could spread out, and not be crowded into Auckland.
Agreed. This is typical of the lack of strategic nous that this govt displays. We are set to continually pour billions upon billions feeding rapid expansion in Auckland when the viability of the regions is under threat. If some of that investment and immigration policy was targeted at regional development we would attract more people to the regions killing two birds with one stone.
I was looking to see if the Author was aware that net migration in New Zealand is out of Auckland. Repeat out. Couldn't see she knew that.
I suspect you are correct, but do you have the data?
would only been seen in census numbers wouldnt it? Even the destination city for migrants is just a tick box, most likely auck as thats where they fly into hence thats their 'destination city' even if plans are to end up elsewhere. I dont know of any paperwork that could give good internal migration data other than infering it from census info
Yep Simon. Try the census. Great info, especially as the question is about internal movement over time.
More choose to move from Auckland to the rest of New Zealand than choose to move the other way. Of course there is a great number choosing and flowing both ways.
yes. The data exists and is from the census. I have posted it on here 3-4 times in the last year. But try this slightly different one. http://www.stats.govt.nz/browse_for_stats/population/Migration/internal…
Probably what this means is the foreign migrants are flooding into Auckland. But "New Zealanders' net are moving out of Auckland. Still means Auckland grows. But locals, including former international migrants I guess, move out in greater numbers than people who choose to move to Auckland from the rest of New Zealand.
In this sort of article there appears to be a focus on the ratio of people in the workforce versus those over 65. However isn't the real issue the ratio of the total population versus the workforce. For instance in the 1950s and 1960s there was a bulge of non-work participants under say 15 but a low number over 65. Thus the ratio of non participants versus participants "may" have been similar, Now the situation is reversing but the ratio of non participants "may" stay the same.
The point being the relative amount required to support and educate the young in the past now shifts to the elderly.
Also I've seen other articles that claim the elderly bulge ends around 2040 and then shrinks back.
Does any one have the figures to support or rebut this viewpoint?
A couple of key things I dont really like about this article.. First using a nz map to show % gain/loss will always look fairly dramatic as 4.5 mill people over a country this size means lots and lots of empty space which in % terms, based on history will likely lose furhter population. I see PN is still predicted to be positive over all periods predicted, even though it hardly stands out being in middle of manawatu-wanganui region thats declining.
Auck has never been so detached price wise from the rest of NZ so past trends can not be easily extrapolated forward. For all of NZ history, Auck, welly similar costs of living, and maybe 30-50% higher house prices than secondary cities;
Today: Auck close to double welly, and 4x many secondary cities.
This factor could not have been included in her models as there is no precedent for it.
People bragging about selling up in auck and living the high life in the regions is not something Ive seen in my time anyway. If auck prices remain stuck high then I can not see auck pop continuing to grow as predicted, not with so much of the rest of the country much more attractive in terms of lifestyle
Nelson / Tasman often shows up as not being a destination for incoming migrants. I think this statistic comes from the cards filled out for passing through the boarder. The census data shows up that in fact our growth is higher than shown on her results. The other interesting statistic that needs to be looked at is number of dwelling building consents issued. When BC's for each TA are expressed as a percentage of number of existing dwellings then a surprising pattern shows up. Forget Wellington it is dead in the water. Then look at number of properties for sale and number being sold as a ratio of existing properties. Again you come up with some figures that are not guess work nor fiction. I challenge some demographers to go back and rework their figures rather then relying on externally produced figures. Thinking property investors know what is going on. If we do not understand we go out of business.
We welcome your comments below. If you are not already registered, please register to comment
Remember we welcome robust, respectful and insightful debate. We don't welcome abusive or defamatory comments and will de-register those repeatedly making such comments. Our current comment policy is here.