
By Amy Thomasson & Sam Warburton*
Regulatory governance is hardly a sexy topic. But given the powers modern day regulators wield over everyday commerce, it warrants our attention.
To spruce things up, we have teamed up to look at one element from the Transport portfolio that raises questions about spending and oversight.
Regulatory governance and monitoring
One way to look at regulatory governance is through the lens of the private sector. Shareholders in a public company are responsible for pulling the board up if it is underperforming.
In a similar way, Ministers and their departments are responsible for monitoring the performance of the statutory Crown entities in their portfolio. And while many of New Zealand’s regulators are directly accountable to a board, all are ultimately accountable to Parliament.
External monitoring markedly enhances accountability. It helps ensure that regulators are performing well and problems are brought to the attention of the Executive.
Regulators must produce accountability documents for various purposes under several statutes. This includes an annual report, where regulators assess their performance against the objectives they set in their Statement of Performance Expectations (SPE) and Statement of Intent (SOI). Annual reports also contain details of financial expenditure.
Annual reports and salaries
As in the private sector, the purpose of annual reports in government is partly marketing and partly transparency. Transparency so investors – in this case, Ministers and the public – can see what value they’re getting for their investment. Annual reports help monitoring departments hold regulators to account.
One thing agencies typically report on is salaries over $100,000. This is an area that journalists enjoy. The statistics are easy and readers can compare it with their own earnings.

 A criticism might be that it’s easy to pick on salaries and there are more important things to investigate. Like shooting ducks in a pool of money.
This will often be true.
Sometimes significant salary changes will be justified.
An organisation might have expanded.
Or it might have changed the mix of its responsibilities, requiring expensive expertise.
Other times, salary changes will point to other questions.
Salary changes at the NZ Transport Agency
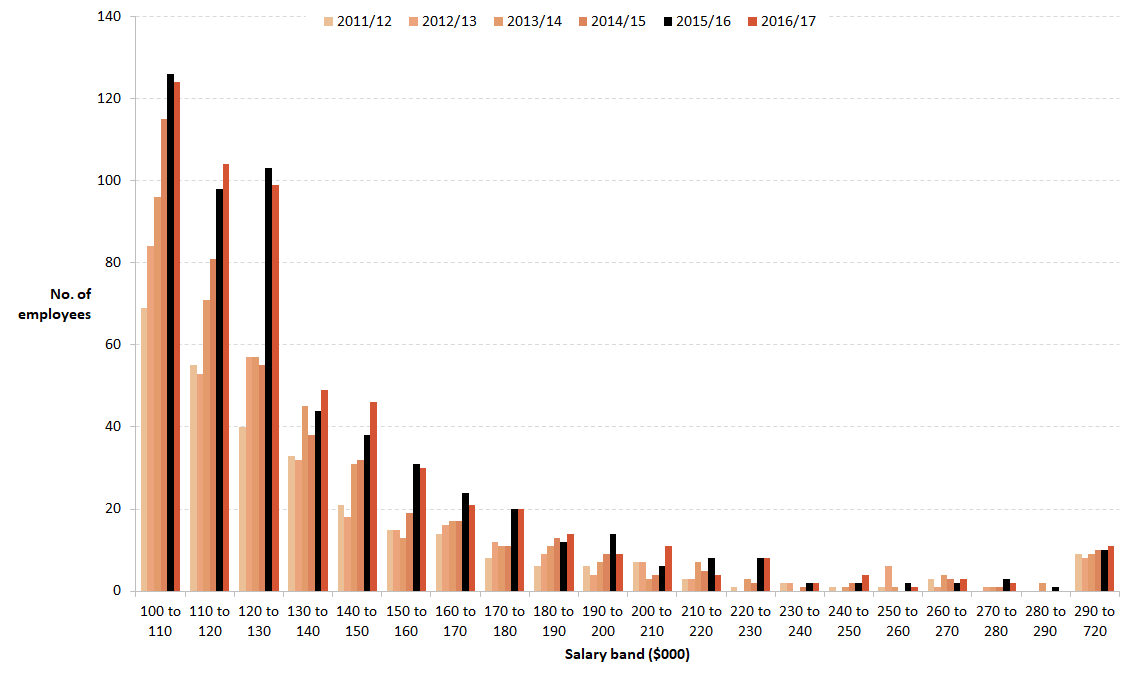
Readers of the NZ Transport Agency’s 2015/16 annual report might have noticed an increase from 418 to 555 in the number of employees being paid more than $100,000.
Figure 1 puts the increase in context over time. Employees are divided into $10,000 salary bands (except for the last one which goes from $290,000 to $720,000).
To the eye, the number of staff in each band increases gradually between 2011/12 and 2014/15, before leaping in 2015/16.
Figure 1: Number of employees by salary band

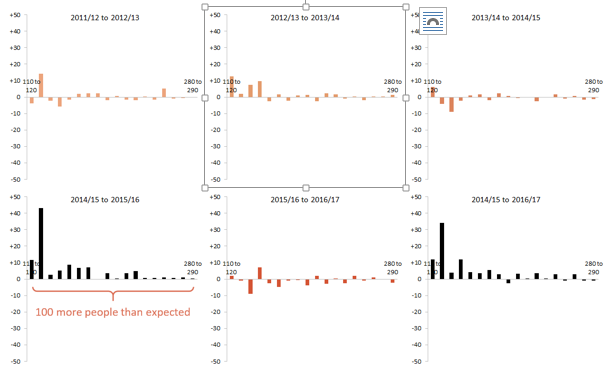
Some of the increase will be caused by general inflation. Figure 2 attempts to account for this.
Figure 2 shows the difference between actual numbers of employees in each band and the expected number in each band had employees been even distributed within the bad and received 2 percent salary increases each year.
That is, if there were ten employees in the $100,000 to $110,000 band, the model assumes there was one employee on $100,000, one on $101,000, another on $102,000, and so on. As salaries increase, those lower in the band move further up the band, and those as the top of the band move into higher bands.
Between 2011/12 and 2014/15, the chart shows some salary bands having more employees than we might expect, and some salary bands having fewer. In general, the overs and unders roughly offset each other.
That is until we get to 2015/16. Two years ago, something happened that caused every salary band to have an increase in employees. An increase more than we’d expect from modest salary increases. About 100 more people than we’d expect.
Who are the 100?
Figure 2: Difference between actual and expected employee counts, $110,000 to $290,000


Maybe the NZ Transport Agency grew in size
Overall employee numbers at the NZ Transport Agency were up in 2015/16, but only slightly. Here are the total full-time equivalent counts by year (as at 30 June):
|
Year |
Total FTEs |
$100,000+ |
|
2012 |
1,347.6 |
294 |
|
2013 |
1,379.8 |
329 |
|
2014 |
1,344.0 |
390 |
|
2015 |
1,322.0 |
418 |
|
2016 |
1,392.0 |
555 |
|
2017 |
1,352.5 |
562 |
In 2015/16, the total number of FTEs increased 5% (from 1,322 to 1,392) but the number of people on salaries greater than $100,000 increased 33%.
In fact, despite the increase in total employees, the number of people on less than $100,000 fell. While the number of people earning above $100,000 increased by 137, the number of people earning less than $100,000 fell by 67.
Maybe the NZ Transport agency has changed direction, requiring expensive expertise
Possibly, but there appears to be no indication of this in public documents.
Further, such a change in salary distributions might be expected following a formal restructure. However, there wasn’t a formal restructure of the NZ Transport Agency until mid-2017 and even after that, the salary distribution was largely unchanged.
So, who are the 100?
Unable to find a clear explanation by either the NZ Transport Agency or Ministry of Transport (who oversees the performance of the NZ Transport Agency), we approached both.
The Ministry of Transport did not respond.
The NZ Transport Agency wrote:
Remuneration Increases
The NZ Transport Agency remuneration movements have been consistent with the public sector and wider NZ market. In 2015 the benchmark data used to determine salary increases moved more, and as a consequence the midpoints for the Transport Agency salary bands also increased, and more employees crossed the $100K threshold.
Size of organisation
There was an increase of 70 FTEs in 2015/16 which resulted in more employees in the $100K plus salary brackets. This was in part the result of recruiting additional staff to manage state highway network programmes. These details are noted on pages 104 and 168 of our 2015/16 annual report.
We found these responses vague and unconvincing.
Remuneration increases
The NZ Transport Agency didn’t provide a reference for the benchmark increases, nor the size of those increases.
In recent years, public sector salary inflation has been a bit below the 2 percent we assumed. Relevant private sector inflation (e.g. in construction) has been a bit above the 2 percent we assumed. Neither would seem to explain much of the salary increases.
In any case, uncertainty about how many employees were just under $100,000 and who might cross the $100,000 threshold is why we didn’t count them. As noted in Figure 2, we’ve only counted people between $110,000 and $290,000.
Size of organisation
It is true that there was an increase in FTEs of 70 in 2015/16 (as we noted earlier).
And the annual report (page 58) does say ‘extra resource was allocated to progress state highway priority programme business cases earlier than initially planned’. However, this resource was in addition to what had already been budgeted. Page 104, which the NZ Transport Agency directed us to, talks of $35 million being spent on staff to manage state highways, down from $40 million the previous year.
It is possible to spend a smaller amount of money on an even smaller number of people and have salaries increase. It is, therefore, plausible that accelerated state highway planning makes up part of the 100.
But it strikes us as unlikely that this explains much of the 100.
The NZ Transport Agency’s vague response has buttressed our suspicion. The Agency only says that the increase in FTEs would have resulting in ‘more’ employees on $100,000, and that this is ‘in part’ due to accelerating state highway planning. If these reasons explained much of the change, we’d expect a more definitive answer.
This brings us to wider questions of external monitoring
Of course, there may well be a good explanation for the increase in the number of people on salaries greater than $100,000. The problem is that if there is a good explanation, it hasn’t been publicly documented. And it should be. Whether that’s by the NZ Transport Agency self-disclosing, or by the Ministry of Transport asking the right questions.
In its report on regulatory institutions and practices in 2014, the Productivity Commission noted that the quality of ministerial monitoring of regulators is incredibly variable, largely because it depends on the interests and tendencies of the responsible minister.
The Productivity Commission also found that most ministers and their monitoring departments focus too much on process and not enough on outcomes. Some simply aren’t interested. Others are too interested. It recommended that department–regulator relationships should move to more formal interactions, based on clearly-defined roles and responsibilities.
The then-Government only “partially agreed” with this recommendation. In response, the then-Minister for Regulatory Reform wrote a letter to regulatory agencies to remind them of the Government’s expectations with regard to monitoring and reporting practices and departmental-regulator relationships. That’s not even the equivalent of a slap on the wrist.
Delivering value to the public through regulation should be taken just as seriously as is profit-maximisation in a public company. It is on this basis that ministers need to be attentive to specific areas of risk and make sure they are asking the right questions, without second-guessing actions of the board.
Perhaps if the Ministry asked NZTA the right questions, we’d know where all that money is going and why.
-------------------------------------------------------
*Amy Thomasson is a research assistant at the New Zealand Initiative. Sam Warburton is a research fellow at the New Zealand Initiative, which provides a fortnightly column for interest.co.nz.
We welcome your comments below. If you are not already registered, please register to comment
Remember we welcome robust, respectful and insightful debate. We don't welcome abusive or defamatory comments and will de-register those repeatedly making such comments. Our current comment policy is here.