

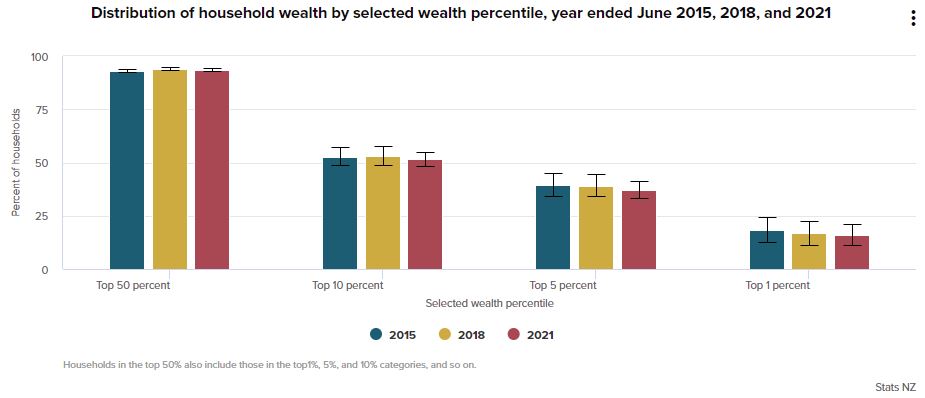
The distribution of household wealth remained unchanged between 2015 and 2021, despite the median net worth of New Zealand households increasing during this period, reported Statistics NZ.
Household median net worth has been increasing for several years and was estimated at $397,000 in 2021, having increased 21% on the previous survey in 2018 and 39% on the first survey of its type in 2015.
Household net worth is calculated as the value of both financial (stocks, bank deposits etc.) and non-financial assets (real estate, vehicles etc.) owned by a household, less its liabilities including mortgages.
“The top 10% of New Zealand households continues to hold approximately 505 of New Zealand’s total household net worth – as they did in 2015, which was Stats NZ’s first household net worth survey of this type,” said Mike Webb, manager wealth and expenditure at Stats NZ.
Property ownership was the key driver: the median household net worth of those who owned or partly owned their home was $635,000 in the year ended June 2021, compared with $54,000 for those renting.
“Those who own their home are typically in a much stronger financial position than those who rent.
“As the net worth survey captures the capital (or rateable) valuation of real estate at the time of the survey, the net worth of homeowners would be even higher when measured with market values above capital value,” said Webb.
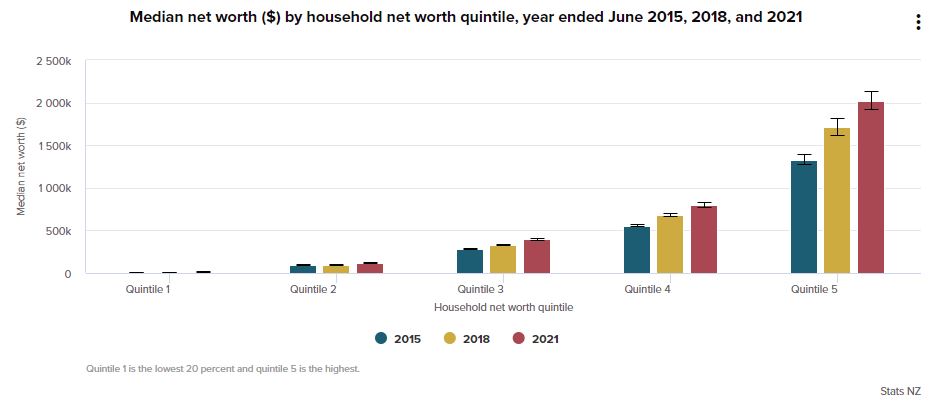
Amid the even distribution, wealth still attracted wealth: the median net worth of the wealthiest 20% (quintile 5) of New Zealand households increased by $313,000 in the last three years to $2.02 million for the year ended June 2021, while the bottom 20% of households (quintile 1) increased by $3,000 during the same period to $11,000.
"Between the quintile groups, there are also significant differences in financial assets including currency, bank deposits, pension funds, shares and other equity, life insurance funds, and annuities.
"Those in the wealthiest 20% have median financial assets of $1.11 million in the year ended June 2021, whereas those in the bottom 20% had a median value of $9,000," said Stats NZ.
The data is the result of a survey of over 4,400 households as part of the Household Economic Survey, but may not provide a representative picture of the extremely rich - their small number made it comparatively unlikely their households were selected.
The building of net worth is linked to age group and typically increases with age until around retirement, and young people (15-24 years) had a median individual net worth of just $3000 in 2021, while those at retirement age (65-74 years) had a healthy $433,000.
"The Household Economic Survey is not designed to measure total wealth but helps to understand the distribution of net worth across the population, as well as how financially prepared kiwis are for their retirement," said Stats NZ.
3 Comments
Only those who are frugal can save save some money, to pay a deposit for a house. Does not apply where no jobs are available.
Few have it easy, like a singer with a hit song or ... an inheritance.
Sorry if one has an addiction to cocaine (or similar).
This article does not address the fact that for most of us, our house is the most valuable asset. And the new generation and immigrants face a huge obstacle.
How many $ to be in the top 1%??
Not a bad report card.
A bit more information about the top end would be useful.
For example, 10m puts you in the top 2 percent or what ever. 12m top 1 percent.
We welcome your comments below. If you are not already registered, please register to comment
Remember we welcome robust, respectful and insightful debate. We don't welcome abusive or defamatory comments and will de-register those repeatedly making such comments. Our current comment policy is here.