Sources: ICE Benchmark Administration, Metals Focus, Refinitiv GFMS, World Gold Council; Disclaimer
*Data to 31 December 2025.
Gold supply and demand
Table 1: Gold supply and demand by sector, tonnes

This content is supplied by the World Gold Council. The original is here.
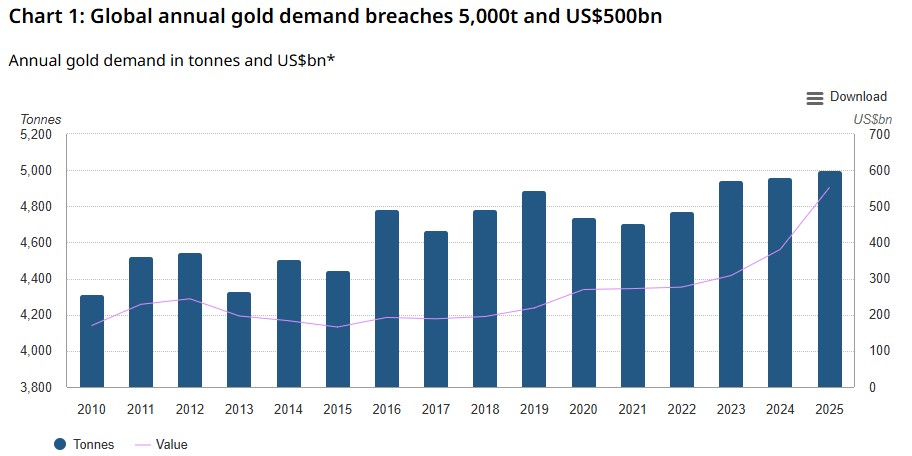
Total gold demand in 2025, including OTC, exceeded 5,000t for the first time. Combined with the record-breaking run in the gold price – setting 53 new all-time highs during the year – this yielded an unprecedented value of US$555bn (+45% y/y).
Heightened investment activity drove overall demand growth: global gold ETF holdings grew 801t – the second strongest year on record – while bar and coin buying accelerated to reach a 12-year high.
Safe-haven and diversification motives were consistent themes driving investment interest throughout the year, along with price-driven motivations.
Central bank purchases of 863t reached the upper end of our expected 2025 range; they remain historically elevated and geographically widespread but have slowed from their recent pace.
A decline in jewelery demand volumes was entirely expected in the environment of successive record gold price highs. Sentiment towards gold jewelery, however, remained very positive, as evidenced by the value of global demand, which climbed 18% to a record US$172bn.
Technology demand was stable despite disruption in the consumer electronics space, supported by continued growth in AI-related applications.
Highlights
The LBMA (PM) gold price set 53 new all-time highs during 2025
The average Q4 price was a record US$4,135/oz (+55% y/y), resulting in the highest annual average of US$3,431/oz (+44% y/y).
Total annual gold supply grew by 1%
Initial estimates suggest mine production inched up to a new record of 3,672t. Recycling activity gained 3% to 1,404t – a relatively muted response to a 67% increase in the US dollar gold price.
Demand also set a Q4 record
Total quarterly demand of 1,303t was the highest ever for a fourth quarter, lifted by hefty ETF inflows (175t) and a 12-year high in bar and coin buying (420t).
Outlook
Looking to the year ahead, with continued geopolitical tensions we expect another year of strong gold ETF inflows and robust bar and coin demand, underpinned by elevated central bank buying. Jewelery to remain weak in a persistent high price environment.
Sources: ICE Benchmark Administration, Metals Focus, Refinitiv GFMS, World Gold Council; Disclaimer
*Data to 31 December 2025.
Gold supply and demand
Table 1: Gold supply and demand by sector, tonnes
| 2024 | 2025 | Annual y/y% change |
Q4'24 | Q4'25 | y/y % change |
||
| Supply | |||||||
| Mine Production | 3,650.4 | 3,671.6 | 1 | 947.1 | 957.7 | 1 | |
| Net Producer Hedging | -53.8 | -73.6 | - | -18.2 | -21.3 | - | |
| Total Mine Supply | 3,596.6 | 3,598.0 | 0 | 929.0 | 936.4 | 1 | |
| Recycled Gold | 1,365.3 | 1,404.3 | 3 | 357.7 | 366.4 | 2 | |
| Total Supply | 4,961.9 | 5,002.3 | 1 | 1,286.7 | 1,302.8 | 1 | |
| Demand | |||||||
| Jewelery Fabrication | 2,026.6 | 1,638.0 | -19 | 524.3 | 438.0 | -16 | |
| Jewelery Consumption | 1,886.9 | 1,542.3 | -18 | 547.9 | 441.5 | -19 | |
| Jewelery Inventory | 139.6 | 95.7 | -31 | -23.6 | -3.5 | - | |
| Technology | 326.2 | 322.8 | -1 | 82.8 | 82.1 | -1 | |
| Electronics | 270.8 | 270.4 | 0 | 68.8 | 69.0 | 0 | |
| Other Industrial | 46.5 | 44.2 | -5 | 11.9 | 11.0 | -7 | |
| Dentistry | 8.9 | 8.2 | -7 | 2.1 | 2.0 | -6 | |
| Investment | 1,185.4 | 2,175.3 | 84 | 344.8 | 595.0 | 73 | |
| Total Bar and Coin | 1,188.3 | 1,374.1 | 16 | 324.4 | 420.5 | 30 | |
| Bars | 862.8 | 1,068.2 | 24 | 236.3 | 324.0 | 37 | |
| Official Coins | 199.9 | 170.5 | -15 | 52.3 | 54.2 | 4 | |
| Medals/Imitation coins | 125.6 | 135.4 | 8 | 35.8 | 42.2 | 18 | |
| ETFs & Similar Products | -2.9 | 801.2 | - | 20.4 | 174.6 | 756 | |
| Central Banks & Other inst. | 1,092.4 | 863.3 | -21 | 366.6 | 230.3 | -37 | |
| Gold Demand | 4,630.6 | 4,999.4 | 8 | 1,318.5 | 1,345.3 | 2 | |
| OTC and Other | 331.3 | 2.9 | -99 | -31.8 | -42.5 | - | |
| Total Demand | 4,961.9 | 5,002.3 | 1 | 1,286.7 | 1,302.8 | 1 | |
| LBMA Gold Price (US$/oz) | 2,386.2 | 3,431.5 | 44 | 2,663.4 | 4,135.2 | 55 | |
Source: Metals Focus, ICE Benchmark Administration, World Gold Council
Note: For an explanation of these terms, please see the Notes and definitions download:
https://www.gold.org/goldhub/data/gold-demand-by-country
We welcome your comments below. If you are not already registered, please register to comment
Remember we welcome robust, respectful and insightful debate. We don't welcome abusive or defamatory comments and will de-register those repeatedly making such comments. Our current comment policy is here.