

By Terry Baucher*
Matthew Gilligan's forceful argument in support of residential property over renting can be summarised as follows:
"The capital growth on houses is not taxed. This gives home ownership another obvious advantage, coupled with the benefit of bank leverage. It is leverage at good growth rates, plus a better tax profile on the capital profits, that really stand the property ownership model up as a winner."
A significant number of Kiwis agree with Matthew according to Reserve Bank statistics.
In 2013 the Reserve Bank estimated the total value of housing to be $717 billion, or 2.7 times greater than the estimated $267 billion held in financial interests such as bank deposits, superannuation schemes, shares and bonds.
But how much of this housing represents residential rental property?
There doesn't seem to be a lot of publicly available data. In a 2009 report for the Tax Working Group, Inland Revenue estimated the value of residential property investment as $200 billion, about a third of the Reserve Bank's then $605 billion valuation for housing.
To find out more, I asked Inland Revenue for details of the total numbers of taxpayers who returned residential rental income.
I also requested a breakdown by entity class of the total rental profits, total rental losses and total net rental income.
Inland Revenue happily obliged with details for the years ended 31st March 1997 to 31st March 2013 inclusive.
The data makes for some fascinating reading. It clearly demonstrates the effects of tax policies over the past 15 years and, although incomplete hints, at how leverage is used tax effectively.
The data also makes apparent why Inland Revenue really, really, really, didn’t like loss attributing qualifying companies (LAQCs).
According to Inland Revenue the total of individuals, trusts, partnerships and companies (including LAQCs) returning residential rental income for the year ended 31 March 1997 was 138,000. By the year ended 31 March 2011 that number had risen to just under 245,000.
It's when the split between the types of investing entities is examined that it gets particularly interesting. From the 2000 year onward the numbers of companies (including LAQCs and trusts) involved rise much more quickly than for individuals and partnerships.
The number of companies returning residential rental income rose twelvefold from 2,400 in March 2000 to a peak of 29,800 for the March 2011 year. Similarly, the number of trusts returning rental income in the same period more than tripled from 7,200 in March 2000 to a high of 22,900 in March 2011.
By contrast the number of individuals and partnerships returning rental income rose from 158,800 in March 2000 to 192,200 in March 2011, a gain of just over 21 %.
The rapid rise in the number of companies and trusts returning rental income coincides with the increase in the top individual tax rate to 39% and the tax advantages each structure offered.
For tax purposes trusts are separate taxable entities with a maximum tax rate of 33% on retained income. This is very useful when the top income tax rate was 39%. Depending on the terms of the trust deed, income can be distributed at the trustees' discretion to beneficiaries who might have a lower income tax rate (19.5% for much of the 2001-2009 period).
Companies also had a top rate of 33% for the 2001 to 2007 years, and then 30% for the 2008 to 2011 income years. However, LAQCs had the advantage of being able to pass any losses through to their shareholders. This made them exceptionally tax efficient: profits were taxed at 33/30%, but losses flowed through to shareholders and therefore effectively could offset income which would otherwise be taxed at 39%.
From 2001 onwards there was aggressive marketing of residential property investment during this period by the likes of Blue Chip.
The schemes promoted by Blue Chip and others sold residential property investment as a zero-cash cost deal. Investors would leverage off the equity in their existing homes to invest.
The maximum possible depreciation of the investment property and its fixtures and fittings was claimed to maximize the available tax deductions. This way the combination of tax refunds and rental income was meant to cover the interest and other running costs.
Simultaneously, there was a remarkable growth in lending after 2000.
According to the Reserve Bank loans from banks and other lending institution rose from $73.7 billion in 2000 to $180.1 billion in 2009. Most of that additional lending was for residential property.
But despite the growth in the number of investors and the amount of funds flowing into residential property, the amount of taxable rental income returned starts falling after 2005.
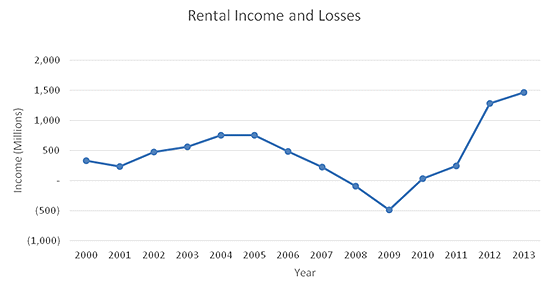
This decline in net rental income from the year ended 31 March 2005 onwards can, as the New Zealand Property Investors Federation argued in relation to the 2009 year, be explained by the increase in interest rates as the Reserve Bank tried to control inflation.
On the other hand, the decline in rental income is also a sign that many investors were heavily leveraging themselves to invest. This becomes more apparent when we look at the returns from companies which shows an even more marked fall.
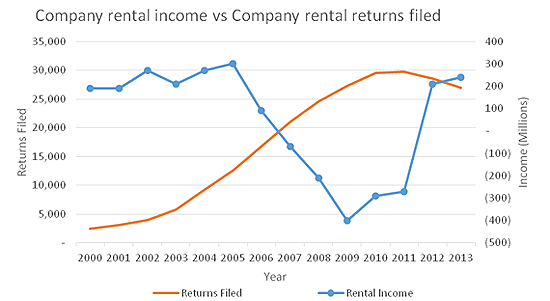
Companies reported net tax losses for each of the tax years from March 2007 to March 2011 inclusive. Over that five year period the losses totaled $1.24 billion, or nearly $250 million each year. By contrast 2009 was the only year in which individuals reported a net loss ($170 million), while trusts and partnerships never reported a net loss in any year.
As LAQCs were also a prominent feature of the Trinity tax avoidance scheme, Inland Revenue, as you can imagine, didn't like how they were being used. Its 2008 Briefing to incoming minister specifically noted the use of companies and trusts to shelter income from the top rate of tax as a risk to the tax base.
It should therefore have come as no surprise when Inland Revenue moved in 2010 to end the use of LAQCs and remove the ability to depreciate buildings.
The effects were dramatic: net rental income returned rose from $250 million for 2011 to $1.29 billion in 2012 and $1.47 billion in 2013.
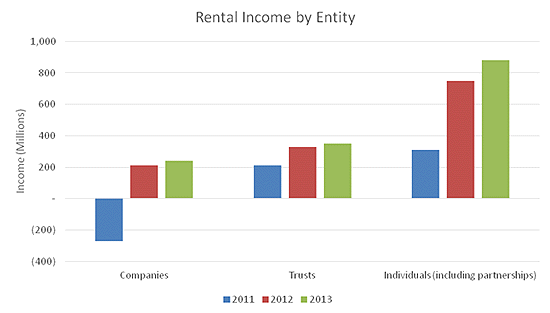
The changes from the 2012 income year have prompted a shakeout of investors with the numbers of companies, trusts and partnerships reporting rental income declining in both the 2012 and 2013 years. Some of this is down to individuals deciding to hold investment properties in their own name.
Others have converted their LAQCs to look-through companies (LTCs).
In this context it’s interesting to note that LTCs returned a net loss of $10 million for the 2012 year and no net income for the 2013 year. This suggests that such entities are still heavily leveraged.
Residential property does undoubtedly have tax advantages but as this article demonstrates tax advantages come and go.
What really matters are the investment fundamentals.
Pay attention to those and any tax benefits should be the icing on the cake, not as often seemed to be the case last decade, the main driver for investment.
This is my final column for 2014. I'd like to thank David Chaston and Gareth Vaughan for giving me the opportunity to ramble on about tax throughout the year. A big thank you also to the many readers who commented on or emailed me about an article. I trust you all have a very Merry Christmas and best wishes for a Happy New Year.
The full information provided by Inland Revenue will shortly be published on my website www.baucherconsulting.co.nz
--------------------------
*Terry Baucher is an Auckland-based tax specialist and head of Baucher Consulting. You can contact him here »
We welcome your comments below. If you are not already registered, please register to comment
Remember we welcome robust, respectful and insightful debate. We don't welcome abusive or defamatory comments and will de-register those repeatedly making such comments. Our current comment policy is here.