
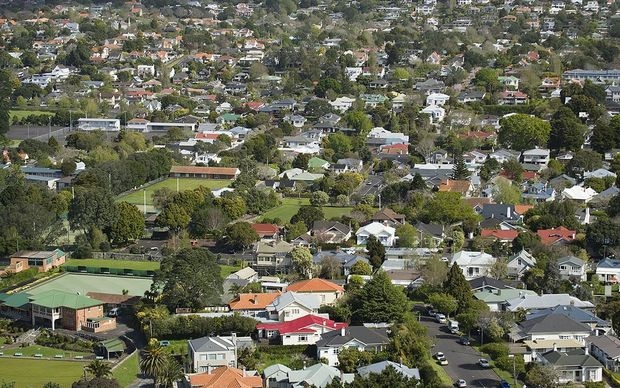
The average value of homes is continuing to fall in Auckland and rise in most of the rest of the country, according to the May figures from Quotable Value.
The average value of homes in Auckland has fallen by just over $20,000 over the last six months, from $1,050,647 in November last year to $1,030,439 in May this year, according to the QV House Price Index.
Although the percentage decline has been relatively small (-1.9%) over that time, it has also been steady, with Auckland's average value declining for the last six consecutive months. It is now 2.1% lower than it was 12 months ago.
In Auckland's main districts the biggest decline has been on the North Shore where average values are down 3.9% compared to a year ago, followed by central Auckland, which includes upmarket suburbs such as Remuera, Epsom, Mt Eden, Grey Lynn, Ponsonby, Herne Bay and Mt Albert, (-2.6%), Waitakere -1.4% and Manukau -0.8%.
However values have been steadier on Auckland's northern and southern fringes over the last year, with the average value in Franklin up 1.0% in May compared to May last year, followed by Papakura +0.7% and Rodney +0.6% (see table below for average values throughout the country).
However while values have been mostly weaker in Auckland they are continuing to rise in the rest of the country. Albeit at a slower rate. The rate of annual growth nationally dropped from 6.9% in May last year to 2.3% at the same time this year, QV says.
Around the main centres, average values were up 4.9% compared to May last year in Hamilton, +5.9% in Tauranga, +7.8% in the Wellington region, +0.7% in Christchurch, +11.5% in Dunedin and +13.5% in Invercargill.
In Queenstown-Lakes, which is the second most expensive place in the country after Coastal North Shore, the average value was $1,182,362 in May, up 0.8% compared to a year earlier.
"Our major centres are seeing the market soften, with Auckland continuing to record single digit negative growth over the quarter and the capital city seeing values plateau over the last three months," QV Senior Consultant Paul McCorry said, adding that the rate of value growth had also started to slow in Dunedin.
"At the same time, many regional centres are still very much in the upward stage of their growth cycle, and continue to achieve strong yearly and quarterly value increases," McCorry said.
"These areas, which are generally more affordable such as Whanganui, Manawatu and Palmerston North, continue to attract plenty of buyer demand.
"Attractive lifestyle regions such as the Bay of Plenty and the Hawke's Bay continue to post good year on year growth.
McCorry also said the sales methods being used to sell properties were changing.
"Our property consultants are reporting that while well presented and competitively priced homes continue to attract multiple offers, gone are the days where every vendor was guaranteed a handful of sealed envelopes on tender day.
"Sellers and their agents are now having to work extra hard to attract buyers towards higher value properties.
"As a result, competitive pricing and effective marketing have become increasingly important parts of the sales process.
"Managing expectations remains key for real estate agents, particularly in the major cities where there can be a disconnect between vendors' price expectations and what buyers are willing to offer," he said.
| QV House Price Index May 2019 | |||
| Territorial authority | Average current value $ | 12 month change% | 3 month change % |
| Auckland region | 1,030,439 | -2.1% | -1.4% |
| Wellington region | 706,517 | 7.8% | 1.0% |
| Total New Zealand | 686,954 | 2.3% | 0.1% |
| Far North | 444,688 | 5.5% | -0.9% |
| Whangarei | 543,957 | 3.1% | 0.4% |
| Kaipara | 546,715 | 1.0% | 0.7% |
| Auckland - Rodney | 959,625 | 0.6% | 0.0% |
| Rodney - Hibiscus Coast | 937,309 | 0.5% | 0.7% |
| Rodney - North | 982,455 | 0.6% | -0.6% |
| Auckland - North Shore | 1,179,660 | -3.9% | -2.2% |
| North Shore - Coastal | 1,352,218 | -3.8% | -1.2% |
| North Shore - Onewa | 943,717 | -3.1% | -2.4% |
| North Shore - North Harbour | 1,145,924 | -5.3% | -4.8% |
| Auckland - Waitakere | 813,218 | -1.4% | -0.7% |
| Auckland - City | 1,210,726 | -2.6% | -1.8% |
| Auckland City - Central | 1,054,828 | -4.3% | -2.0% |
| Auckland_City - East | 1,536,378 | -1.7% | -1.3% |
| Auckland City - South | 1,073,038 | -2.1% | -2.1% |
| Auckland City - Islands | 1,109,858 | -1.7% | -2.3% |
| Auckland - Manukau | 892,511 | -0.8% | -0.5% |
| Manukau - East | 1,135,425 | -1.8% | -0.5% |
| Manukau - Central | 691,061 | -0.4% | -1.1% |
| Manukau - North West | 781,391 | 0.8% | 0.4% |
| Auckland - Papakura | 707,659 | 0.7% | 1.6% |
| Auckland - Franklin | 673,851 | 1.0% | 0.0% |
| Thames Coromandel | 760,366 | 3.3% | 0.7% |
| Hauraki | 422,702 | 0.0% | 1.4% |
| Waikato | 494,762 | 2.5% | 1.5% |
| Matamata Piako | 483,142 | 8.7% | 0.7% |
| Hamilton | 585,155 | 4.9% | 0.8% |
| Hamilton - North East | 730,259 | 3.2% | 1.1% |
| Hamilton - Central & North West | 539,602 | 5.0% | 0.5% |
| Hamilton - South East | 540,417 | 6.3% | 1.0% |
| Hamilton - South West | 520,295 | 5.8% | 0.5% |
| Waipa | 571,278 | 4.6% | 0.9% |
| Otorohanga | N/A | N/A | N/A |
| South Waikato | 258,993 | 18.0% | 2.0% |
| Waitomo | 235,562 | 10.3% | 7.6% |
| Taupo | 518,719 | 8.3% | 1.4% |
| Western BOP | 675,491 | 7.3% | 3.6% |
| Tauranga | 741,501 | 5.9% | 2.3% |
| Rotorua | 475,164 | 13.2% | 4.0% |
| Whakatane | 470,665 | 9.2% | 1.3% |
| Kawerau | 259,883 | 29.3% | 6.3% |
| Opotiki | 324,499 | 6.7% | 5.6% |
| Gisborne | 349,327 | 13.0% | 4.7% |
| Wairoa | 204,825 | 4.2% | 1.7% |
| Hastings | 519,759 | 14.0% | 1.6% |
| Napier | 556,665 | 9.8% | 1.4% |
| Central Hawkes Bay | 378,015 | 15.2% | 1.7% |
| New Plymouth | 462,388 | 2.9% | 0.9% |
| Stratford | 281,335 | 6.3% | 3.9% |
| South Taranaki | 241,793 | 10.5% | 2.7% |
| Ruapehu | 213,127 | 12.6% | -2.0% |
| Whanganui | 296,161 | 16.9% | 9.1% |
| Rangitikei | 231,438 | 13.1% | 5.2% |
| Manawatu | 385,062 | 13.8% | 6.6% |
| Palmerston North | 442,275 | 13.8% | 1.8% |
| Tararua | 231,465 | 17.8% | 3.1% |
| Horowhenua | 364,487 | 16.2% | 5.1% |
| Kapiti Coast | 597,386 | 7.0% | 2.3% |
| Porirua | 593,179 | 6.7% | 0.4% |
| Upper Hutt | 557,909 | 14.7% | 3.2% |
| Lower Hutt | 584,855 | 9.7% | 1.8% |
| Wellington City | 829,167 | 6.3% | 0.6% |
| Wellington - Central & South | 818,850 | 6.1% | -0.8% |
| Wellington - East | 894,209 | 7.2% | 2.3% |
| Wellington - North | 759,928 | 7.8% | 1.4% |
| Wellington - West | 935,754 | 3.3% | -0.2% |
| Masterton | 382,188 | 12.3% | 1.6% |
| Carterton | 434,161 | 11.2% | 4.5% |
| South Wairarapa | 507,205 | 6.4% | -0.5% |
| Tasman | 602,759 | 5.4% | 0.6% |
| Nelson | 624,574 | 8.3% | 2.0% |
| Marlborough | 481,999 | 3.8% | 1.9% |
| Kaikoura | N/A | N/A | N/A |
| Buller | 193,464 | 2.4% | 0.0% |
| Grey | 217,432 | 0.6% | 2.0% |
| Westland | 252,682 | 3.4% | -1.3% |
| Hurunui | 388,012 | 1.1% | 0.3% |
| Waimakariri | 448,071 | 1.8% | -0.5% |
| Christchurch | 498,801 | 0.7% | 0.7% |
| Christchurch - East | 377,323 | 1.6% | 0.6% |
| Christchurch - Hills | 682,648 | 1.6% | 2.6% |
| Christchurch - Central & North | 587,640 | 0.9% | 0.7% |
| Christchurch - Southwest | 472,749 | -0.4% | 0.0% |
| Christchurch - Banks Peninsula | 521,713 | 1.5% | 1.1% |
| Selwyn | 555,471 | 1.2% | 0.2% |
| Ashburton | 359,052 | 1.3% | 0.7% |
| Timaru | 371,408 | 4.0% | 0.8% |
| MacKenzie | 545,398 | 5.7% | 8.5% |
| Waimate | 256,915 | 5.5% | 3.7% |
| Waitaki | 321,245 | 5.3% | 2.0% |
| Central Otago | 524,239 | 6.5% | 0.2% |
| Queenstown Lakes | 1,182,362 | 0.8% | -1.9% |
| Dunedin | 456,183 | 11.5% | 1.6% |
| Dunedin - Central & North | 474,085 | 10.5% | 2.5% |
| Dunedin - Peninsular & Coastal | 408,789 | 7.7% | 0.5% |
| Dunedin - South | 436,797 | 12.6% | 1.8% |
| Dunedin - Taieri | 474,468 | 13.6% | 1.0% |
| Clutha | 229,340 | 10.8% | 4.9% |
| Southland | 314,323 | 12.6% | 2.7% |
| Gore | 236,168 | 6.5% | -0.2% |
| Invercargill | 299,672 | 13.5% | 4.2% |
| Main Urban Areas | 790,282 | 1.0% | -0.3% |
The comment stream on nthis story is now closed.
We welcome your comments below. If you are not already registered, please register to comment
Remember we welcome robust, respectful and insightful debate. We don't welcome abusive or defamatory comments and will de-register those repeatedly making such comments. Our current comment policy is here.