
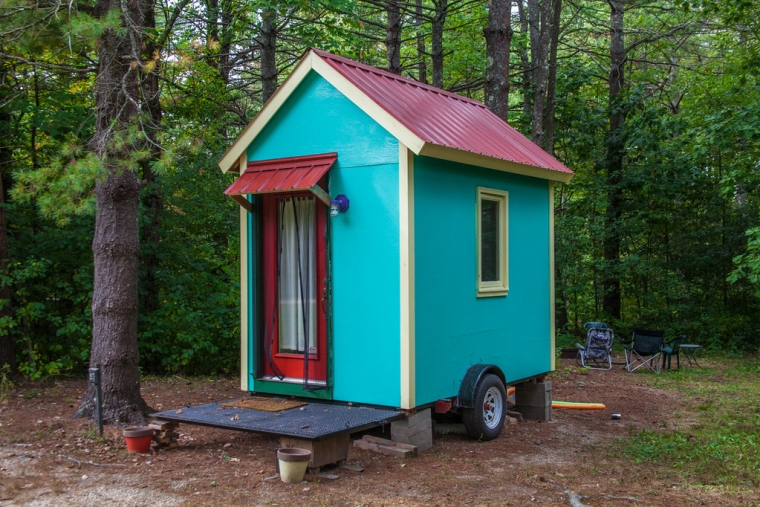
Residential construction costs are continuing to rise rapidly even though the average size of new homes is declining.
Statistics NZ figures show that 37,538 new dwelling consents were issued in 2019, up 13.8% compared to 2018. The biggest increases occurred in the Tasman Region +26.9%, followed by Gisborne +21.7%, Taranaki +20.9% and Auckland +17.8% (see Table 1 below).
Not surprisingly, the biggest increase in absolute numbers was in Auckland where the number of new dwelling consents rose from 12,862 in 2018 to 15,154 in 2019, accounting for 40.4% of all consents issued across the entire country.
The only regions to record a decline in new dwelling consents last year compared to 2018 were Northland -3.2% and Manawatu/Whanganui -2.2%.
While the number of new homes being consented has been increasing, their average size has been decreasing for almost a decade.
The average floor area of all new dwelling consents issued throughout the country has been in more or less steady decline since 2010 when it was 200 square metres, with the decline gathering pace since 2014.
Last year the average floor area of all consents issued was 158 square metres, down 21% compared to 2010 (see Table 2 below).
That decline is not just due to more high density properties such as apartments being built, because a closer look at the figures reveals that the average size is declining for almost all residential property types.
The average size of stand alone houses being consented has declined from 216 square metres to 2010 to 194 square metres in in 2019 (-10.2%), townhouses and home units have declined by 6% over the same period from an average 116 square metres to 109 square metres while average apartment sizes have declined by 13.8%, from 109 square metres in 2010 to 94 square metres last year.
The only type of residential dwelling not to record a drop in the average size since 2010 was retirement village units, which recorded a marginal increase of 2.6%, from 115 square metres to 118 square metres, although retirement village figures tend to be more volatile than those for other housing types.
Over the same period, average construction costs have been steadily rising.
In 2010, the average construction cost of all new dwellings consented was $1394 per square metre (excluding non-construction costs such the cost of land and marketing expenses), and by 2019 that had increased by 67.6% to $2337 per square metre.
That pushed the average construction cost per dwelling up by 32.7% over the same period, from $278,209 in 2010 to $369,318 last year.
The good news in the cost figures is that the greater proportion of higher density homes such as apartments and home units being built in Auckland does appear to be bringing down total costs per unit, even though costs per square metre continue to rise substantially.
Between 2010 and 2019 the average cost of new dwellings consented in Auckland shot up by 74.9%, from $1411 per square metre to $2468 per square metre.
However the rising costs of construction in Auckland have been mitigated by the growth of multi-unit developments in the city, which have pulled down the average size of new dwellings.
In 2010 multi-unit developments such as apartments, home units and townhouses accounted for just 9.6% of all new dwelling consents issued in Auckland, but by last year that had increased to 50.6%.
That brought the average size of new dwellings consented in Auckland down by 30% over the same period, from 219 square metres in 2010 to 153 square metres in 2019.
That drop in average dwelling size saw the average total construction costs of all new dwellings consented in Auckland peak at $399,453 in 2016 and it has since fallen back by 5.2% to $378,577 last year, even though costs per square metre are continuing to rise strongly.
The figures suggest marginal savings in construction costs in Auckland are being achieved by reducing the average size of the new homes being built.
The challenge for the building industry is make significant reductions in the per square metre costs of construction which could have a more meaningful impact on the cost of new housing and its affordability, particularly for first home buyers.
That will likely depend on the introduction of more efficient construction methods, possibly such as greater use of high volume, prefabricated construction techniques and making the supply chain more efficient and competitive to bring down the cost of building materials.
The comment stream on this story is now closed.
Table 1:
| New Dwelling Consents Issued by Region 2018-2019 | |||
| 2018 | 2019 | % change 2018-2019 | |
| Northland Region | 1,156 | 1,119 | -3.2% |
| Auckland Region | 12,862 | 15,154 | 17.8% |
| Waikato Region | 3,742 | 4,251 | 13.6% |
| Bay of Plenty Region | 1,996 | 2,146 | 7.5% |
| Gisborne Region | 83 | 101 | 21.7% |
| Hawke's Bay Region | 621 | 714 | 15.0% |
| Taranaki Region | 464 | 561 | 20.9% |
| Manawatu-Whanganui Region | 1,201 | 1,175 | -2.2% |
| Wellington Region | 2,731 | 3,174 | 16.2% |
| West Coast Region | 126 | 139 | 10.3% |
| Canterbury Region | 4,769 | 5,308 | 11.3% |
| Otago Region | 2,001 | 2,286 | 14.2% |
| Southland Region | 281 | 321 | 14.2% |
| Tasman Region | 394 | 500 | 26.9% |
| Nelson Region | 303 | 312 | 3.0% |
| Marlborough Region | 258 | 276 | 7.0% |
| New Zealand | 32,996 | 37,538 | 13.8% |
| Source: Statistics NZ | |||
Table 2:
| New Dwelling Consents Issued in 2019 | ||||
| Average Size and Cost | ||||
| Number issued | Average value per consent $ | Average floor area sqm | Average cost $/sqm | |
| Northland Region | 1,119 | 414,006 | 184 | 2,250 |
| Auckland Region | 15,154 | 378,577 | 153 | 2,468 |
| Waikato Region | 4,251 | 352,204 | 163 | 2,160 |
| Bay of Plenty Region | 2,146 | 379,917 | 162 | 2,338 |
| Gisborne Region | 101 | 372,170 | 163 | 2,286 |
| Hawke's Bay Region | 714 | 426,524 | 180 | 2,364 |
| Taranaki Region | 561 | 363,095 | 183 | 1,988 |
| Manawatu-Whanganui Region | 1,175 | 333,438 | 168 | 1,980 |
| Wellington Region | 3,174 | 333,039 | 130 | 2,562 |
| West Coast Region | 139 | 288,943 | 149 | 1,940 |
| Canterbury Region | 5,308 | 345,746 | 164 | 2,114 |
| Otago Region | 2,286 | 426,628 | 164 | 2,600 |
| Southland Region | 321 | 355,412 | 180 | 1,973 |
| Tasman Region | 500 | 359,611 | 167 | 2,154 |
| Nelson Region | 312 | 332,656 | 138 | 2,407 |
| New Zealand | 37,538 | 369,318 | 158 | 2,337 |

We welcome your comments below. If you are not already registered, please register to comment
Remember we welcome robust, respectful and insightful debate. We don't welcome abusive or defamatory comments and will de-register those repeatedly making such comments. Our current comment policy is here.