
House price growth remains strongest in Wellington and several provincial centres and much weaker in Auckland and Christchurch, according to the Real Estate Institute of New Zealand's House Price Index (HPI).
The HPI probably gives a better indication of market price movements than either medians or averages because it allows for changes in the composition of housing types that are sold each month.
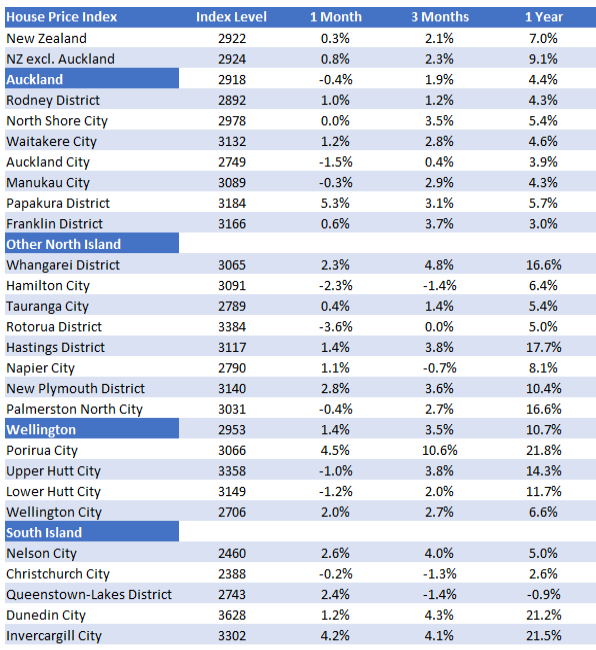
It showed an annual increase of 7% across the entire country between January last year and January this year, but price growth varied widely in different parts of the country (see table below for the regional breakdown).
In Auckland annual price growth was just 4.4% over the same period, while in the rest of the country excluding Auckland the annual growth was 9.1%, suggesting the regions are still the main drivers of price growth.
Within the Auckland region the annual price growth ranged from 3.0% in Franklin on Auckland's southern boundary to 5.7% in nearby Papakura.
Price growth was even weaker in Christchurch, with the HPI for the city increasing by just 2.6% in the year to January and declining by 1.3%.in the three months to January.
The weakest prices in the country were in Queenstown-Lakes, with the HPI for that district declining by 0.9% in the year to January and dropping by 1.4% in the three months to January.
The areas where price growth was strongest were Porirua where the HPI increased by 21.8%% in the year to January, followed by Invercargill 21.5%, Dunedin 21.2%, Hastings 17.7% and Whangarei 16.6%.
The comment stream on thsi story is now closed.
REINZ House Price Index
We welcome your comments below. If you are not already registered, please register to comment
Remember we welcome robust, respectful and insightful debate. We don't welcome abusive or defamatory comments and will de-register those repeatedly making such comments. Our current comment policy is here.