
Residential building activity remains very strong around the country, even as migration inflows show no signs of returning.
Building consent levels suggest this activity will continue for some time.
Aggressive new building has been a feature in Christchurch ever since the 2010/2011 earthquakes required large parts of the city to be abandoned and rebuilt further inland. This rebuild activity kept new supply ahead of population growth and as a consequence house price growth lagged almost all other major urban centers.
New data supplied by Blackburn Management is allowing us to see how building costs have risen in Christchurch over the past five years - and the short answer is, these costs are not especially restrained in the Garden City, and little different from all the other major centers.
The data in this article relates to stand alone houses only, and is sourced from each of the three councils in the greater Christchurch urban area; the Christchurch City Council, the Selwyn Dristrict Council, and the Waimakariri District Council.
Overall, consent costs have risen from about $1825/m2 in January 2018 to $2050/m2 by April 2021 for a full new house. That is average growth of +3.8% pa. Actually, that is faster than in Auckland, where new build consent values rose only +2.8% pa in the same period, to now at $2324/m2 and +13% higher than Christchurch. (And remember, consent values do not include land of course.) The following chart is a weighted result for the data from each of the three local authorities.
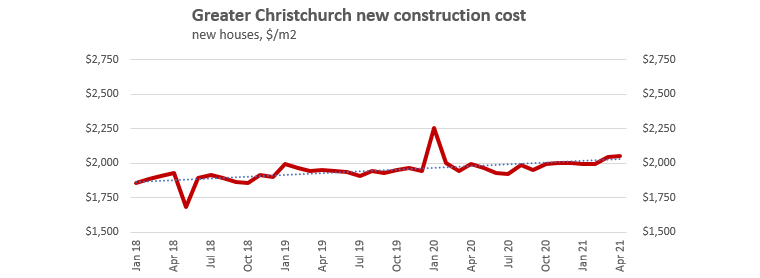
The further from the City centre, the lower the costs, presumable because simpler starter homes area larger proportion of all new-builds.
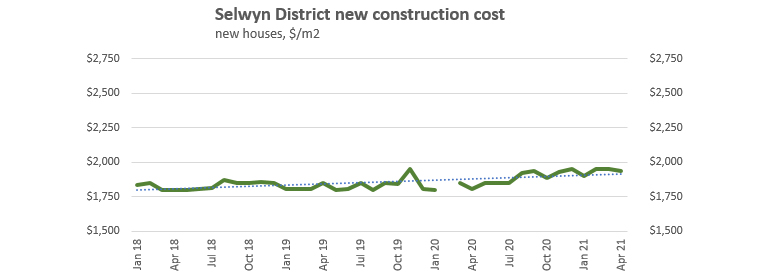
Here is the same track for the Selwyn District Council.
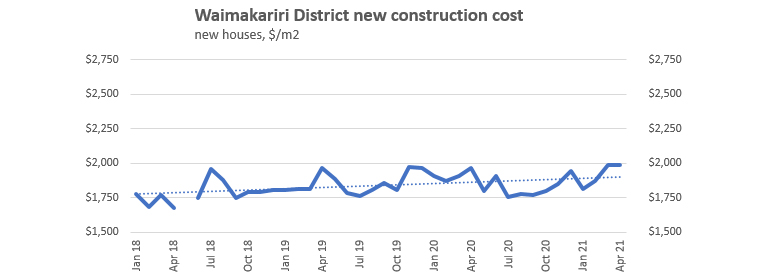
And here is the equivalent data for the Waimakariri District Council.
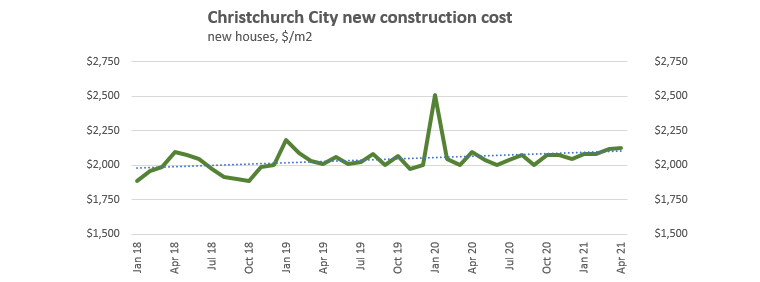
For Christchurch City itself, the new-build consent values are much higher for stand-alone houses.
Intensive multi-unit dwellings are mostly being built in the Christchurch city center environs, and there is a very wide range of types involved, from the high-cost up-market developments, retirement communities of all sorts, to much more modest affordable housing developments. Typically, smaller sized dwellings come with higher costs per m2.
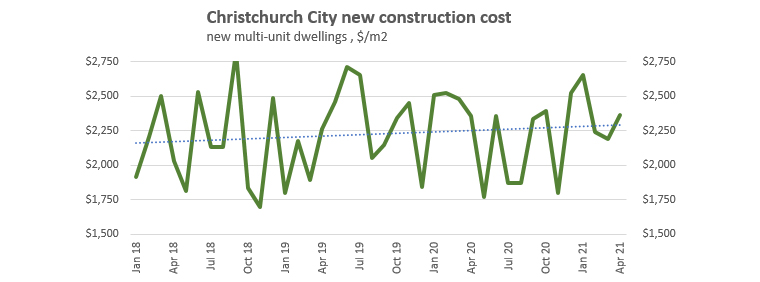
This multi-unit set is excluded from the first four charts above.
We welcome your comments below. If you are not already registered, please register to comment
Remember we welcome robust, respectful and insightful debate. We don't welcome abusive or defamatory comments and will de-register those repeatedly making such comments. Our current comment policy is here.