
Statistics NZ figures show a reasonable upturn in the number of new homes consented in the third quarter of this year and an even stronger increase in building costs.
The latest Statistics NZ data show new dwelling consents for all of Aotearoa peaked at 13,251 in the third quarter of 2021 and then declined in each of the following three quarters.
But consents then perked up to 13,247 in the third quarter of this year, meaning the number of new homes consented in the three months ended September this year was almost unchanged from last year's peak.
However there was no such volatility in the estimated build costs for new dwellings, which have continued to rise steadily.
Building consent analysis by interest.co.nz shows the average estimated build cost, excluding the cost of land, for all new dwelling consents has now risen for seven consecutive quarters.
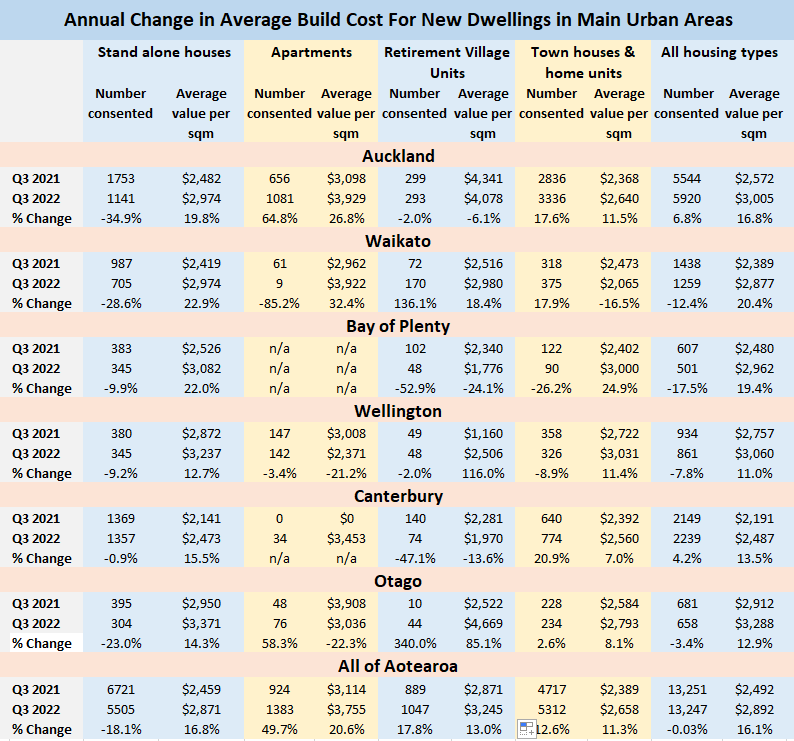
In the third quarter of this year the average estimated build cost, across all regions and dwelling types, was $2892 per square metre, up 16.1% compared to the third quarter of last year.
The smallest annual increase in estimated build costs was for townhouses and home units which were up 11.3% for the year to September, followed by retirement village units +13%, stand-alone houses +16.8% and apartments +20.6%.
Double digit annual increases in estimated build costs were recorded in all of the main urban districts of Auckland +16.8% (across all dwelling types), Waikato +20.4%, Bay of Plenty +19.4%, Wellington +11.0%, Canterbury +13.5% and Otago +12.9%.
However the actual inflation figures may be even higher than those numbers suggest, because those figures are based on estimates of costs provided by builders/developers at the time they lodged their applications for building consents and probably do not reflect cost increases for things such as materials and labour they may have faced subsequent to a consent being issued.
Interest.co.nz's Building Consent Analysis Tables provide a breakdown of new dwelling consents by average floor area, average value and average value per square metre, for all major dwelling types, nationally and in each major urban district. These are available here and are updated quarterly.
The table below is a summary showing the number of new dwelling consents issued each quarter and their average cost per square metre by housing type and major urban district.
The comment stream on this story is now closed.
- You can have articles like this delivered directly to your inbox via our free Property Newsletter. We send it out 3-5 times a week with all of our property-related news, including auction results, interest rate movements and market commentary and analysis. To start receiving them, register here (it's free) and when approved you can select any of our free email newsletters.
We welcome your comments below. If you are not already registered, please register to comment
Remember we welcome robust, respectful and insightful debate. We don't welcome abusive or defamatory comments and will de-register those repeatedly making such comments. Our current comment policy is here.