
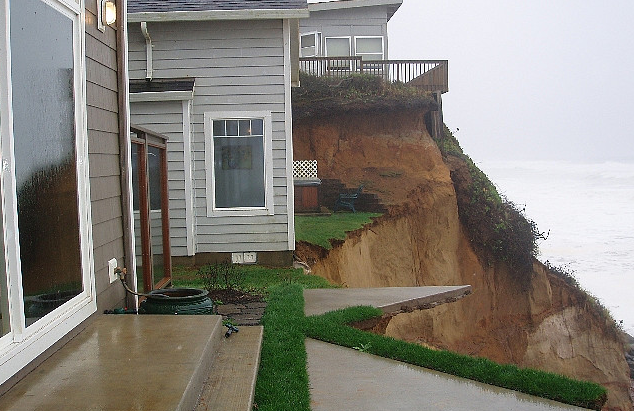
Falling house prices are now a features of the market in nearly every part of the country and look likely to persist for the rest of the summer at least.
A year has passed since house prices peaked in November 2021 and the latest figures from the Real Estate Institute of NZ show how much prices have fallen back since then.
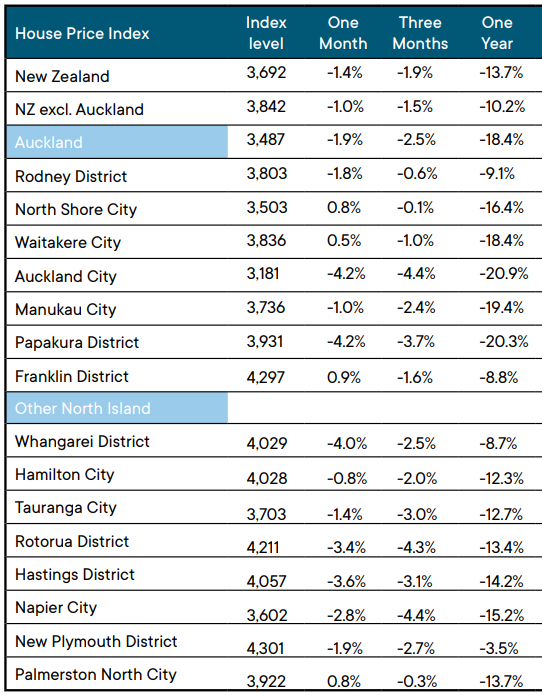
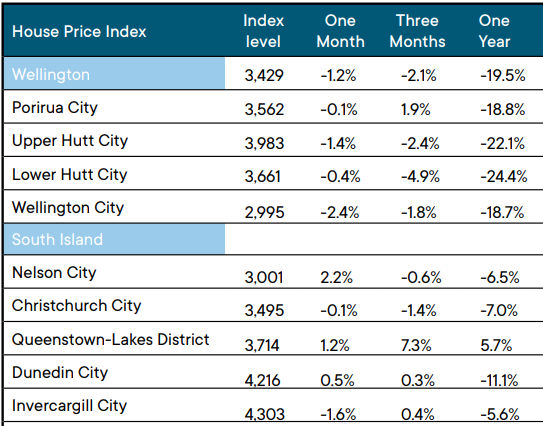
The REINZ's House Price Index (HPI), which takes into account changes in the mix of properties sold each month and is widely considered the most accurate measure of overall market price movements, shows a national price decline of 13.7% since November last year, while the REINZ's national median price declined by 12.4% over the same period.
In the major centres of Auckland and Wellington the annual median price falls were even greater at -18.1% and -17.4% respectively.
The HPI was lower in November this year than it was in November last year in all major urban districts except Queenstown-Lakes. Of the 38 urban districts where interest.co.nz compared median prices in November this year with those in November last year, 33 showed declines and only five districts - Rotorua, Taupo, West Coast, Queenstown-Lakes and Invercargill, had higher median prices than they did a year ago.
The tables below show the trends for both the HPI and median prices by location.
The fact that the HPI and median figures both shows similar levels of price decline, and that price falls have in most cases been substantial and widespread, along with the sluggish state of the residential property market, suggest the slide in prices is not going to end any time soon.
In an Economic Note on the latest REINZ figures, ASB's economists stated bluntly: "This is not a market to turn around," and increased their forecast of how much the national selling price might fall from last year's peak to 25%.
"The NZ housing market looks to be continuing to decelerate based on data out from REINZ," the report said.
"On a seasonally adjusted basis, the REINZ house price indices have eased for a twelfth consecutive month on the trot as of November.
"What's more, last month's 1.9% month-on-month fall was the largest monthly fall in house prices since December 2000.
"Rather than getting closer to a floor, the present housing market downturn may be increasing in pace," the report warned.
The comment stream on this story is now closed.
REINZ House Price Index - November 2022
| REINZ Median Selling Price | ||||
| Change from November 2021 to November 2022 | ||||
| District | November 2021 | November 2022 | $ Change | % Change |
| Northland | $750,000 | $729,500 | -$20,500 | -2.7% |
| Rodney | $1,315,000 | $1,225,000 | -$90,000 | -6.8% |
| North Shore | $1,550,000 | $1,290,070 | -$259,930 | -16.8% |
| Waitakere | $1,190,000 | $920,000 | -$270,000 | -22.7% |
| Central suburbs | $1,540,000 | $1,190,000 | -$350,000 | -22.7% |
| Manukau | $1,230,000 | $1,050,000 | -$180,000 | -14.6% |
| Papakura | $1,130,000 | $850,000 | -$280,000 | -24.8% |
| Franklin | $973,000 | $900,000 | -$73,000 | -7.5% |
| Auckland Region | $1,300,000 | $1,065,000 | -$235,000 | -18.1% |
| Hamilton | $881,000 | $790,000 | -$91,000 | -10.3% |
| Tauranga | $1,000,000 | $902,000 | -$98,000 | -9.8% |
| Rotorua | $680,000 | $685,000 | $5,000 | 0.7% |
| Taupo | $790,000 | $823,500 | $33,500 | 4.2% |
| Gisborne | $685,000 | $660,000 | -$25,000 | -3.6% |
| Napier | $830,000 | $723,000 | -$107,000 | -12.9% |
| Hastings | $870,000 | $700,000 | -$170,000 | -19.5% |
| New Plymouth | $720,000 | $650,000 | -$70,000 | -9.7% |
| Whanganui | $542,500 | $450,000 | -$92,500 | -17.1% |
| Palmerston North | $720,000 | $625,000 | -$95,000 | -13.2% |
| Kapiti Coast | $910,000 | $840,000 | -$70,000 | -7.7% |
| Porirua | $1,013,000 | $815,000 | -$198,000 | -19.5% |
| Upper Hutt | $920,143 | $762,500 | -$157,643 | -17.1% |
| Lower Hutt | $920,000 | $675,000 | -$245,000 | -26.6% |
| Wellington City | $1,099,000 | $920,000 | -$179,000 | -16.3% |
| Wellington Region | $962,500 | $795,000 | -$167,500 | -17.4% |
| Nelson | $736,000 | $700,000 | -$36,000 | -4.9% |
| Marlborough | $705,000 | $700,000 | -$5,000 | -0.7% |
| Tasman | $870,000 | $869,500 | -$500 | -0.1% |
| West Coast | $350,000 | $420,000 | $70,000 | 20.0% |
| Christchurch | $700,500 | $680,000 | -$20,500 | -2.9% |
| Selwyn | $870,000 | $790,000 | -$80,000 | -9.2% |
| Timaru | $445,000 | $460,000 | $15,000 | 3.4% |
| Canterbury | $690,000 | $668,000 | -$22,000 | -3.2% |
| Central Otago | $760,000 | $730,000 | -$30,000 | -3.9% |
| Queenstown-Lakes | $1,230,000 | $1,350,000 | $120,000 | 9.8% |
| Dunedin | $650,000 | $600,000 | -$50,000 | -7.7% |
| Otago | $730,000 | $685,000 | -$45,000 | -6.2% |
| Invercargill | $462,000 | $485,000 | $23,000 | 5.0% |
| All of Aotearoa | $925,000 | $810,000 | -$115,000 | -12.4% |
We welcome your comments below. If you are not already registered, please register to comment
Remember we welcome robust, respectful and insightful debate. We don't welcome abusive or defamatory comments and will de-register those repeatedly making such comments. Our current comment policy is here.